Gases in the Atmosphere

AQA-style Exam Question

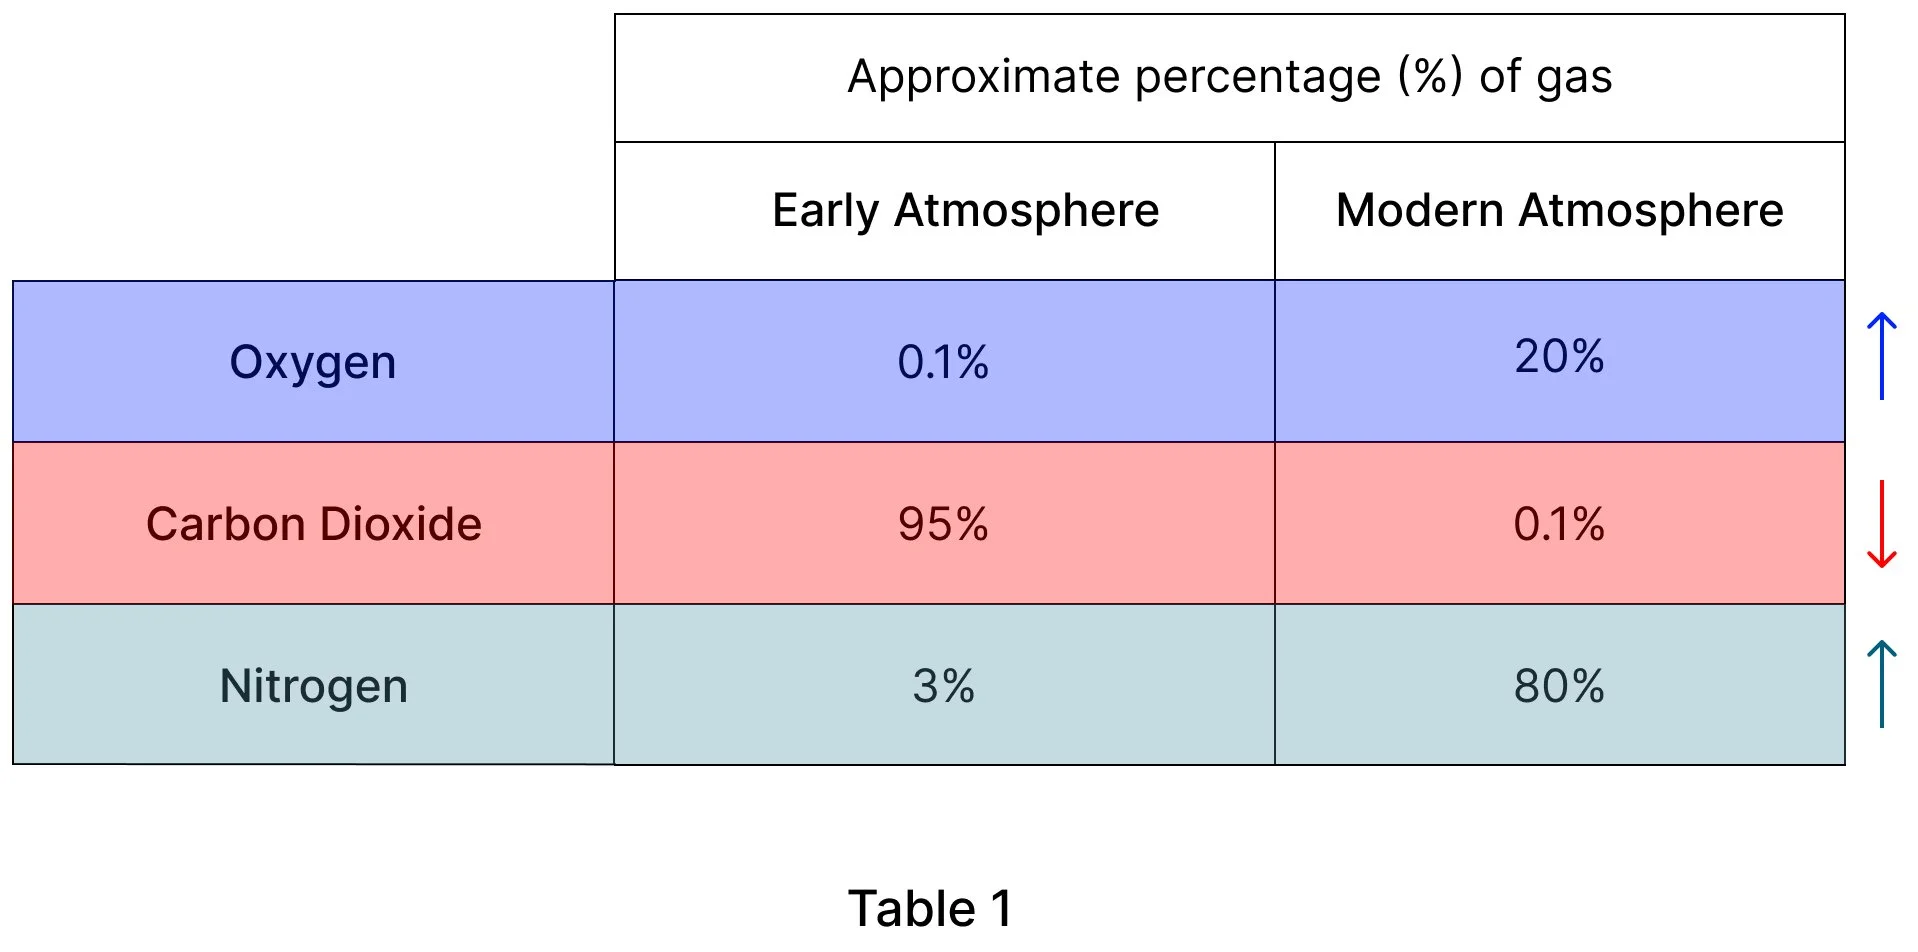
The percentages of gases in the Earth’s early atmosphere have changed. Explain* these changes, based on Table 1.

[6 marks]
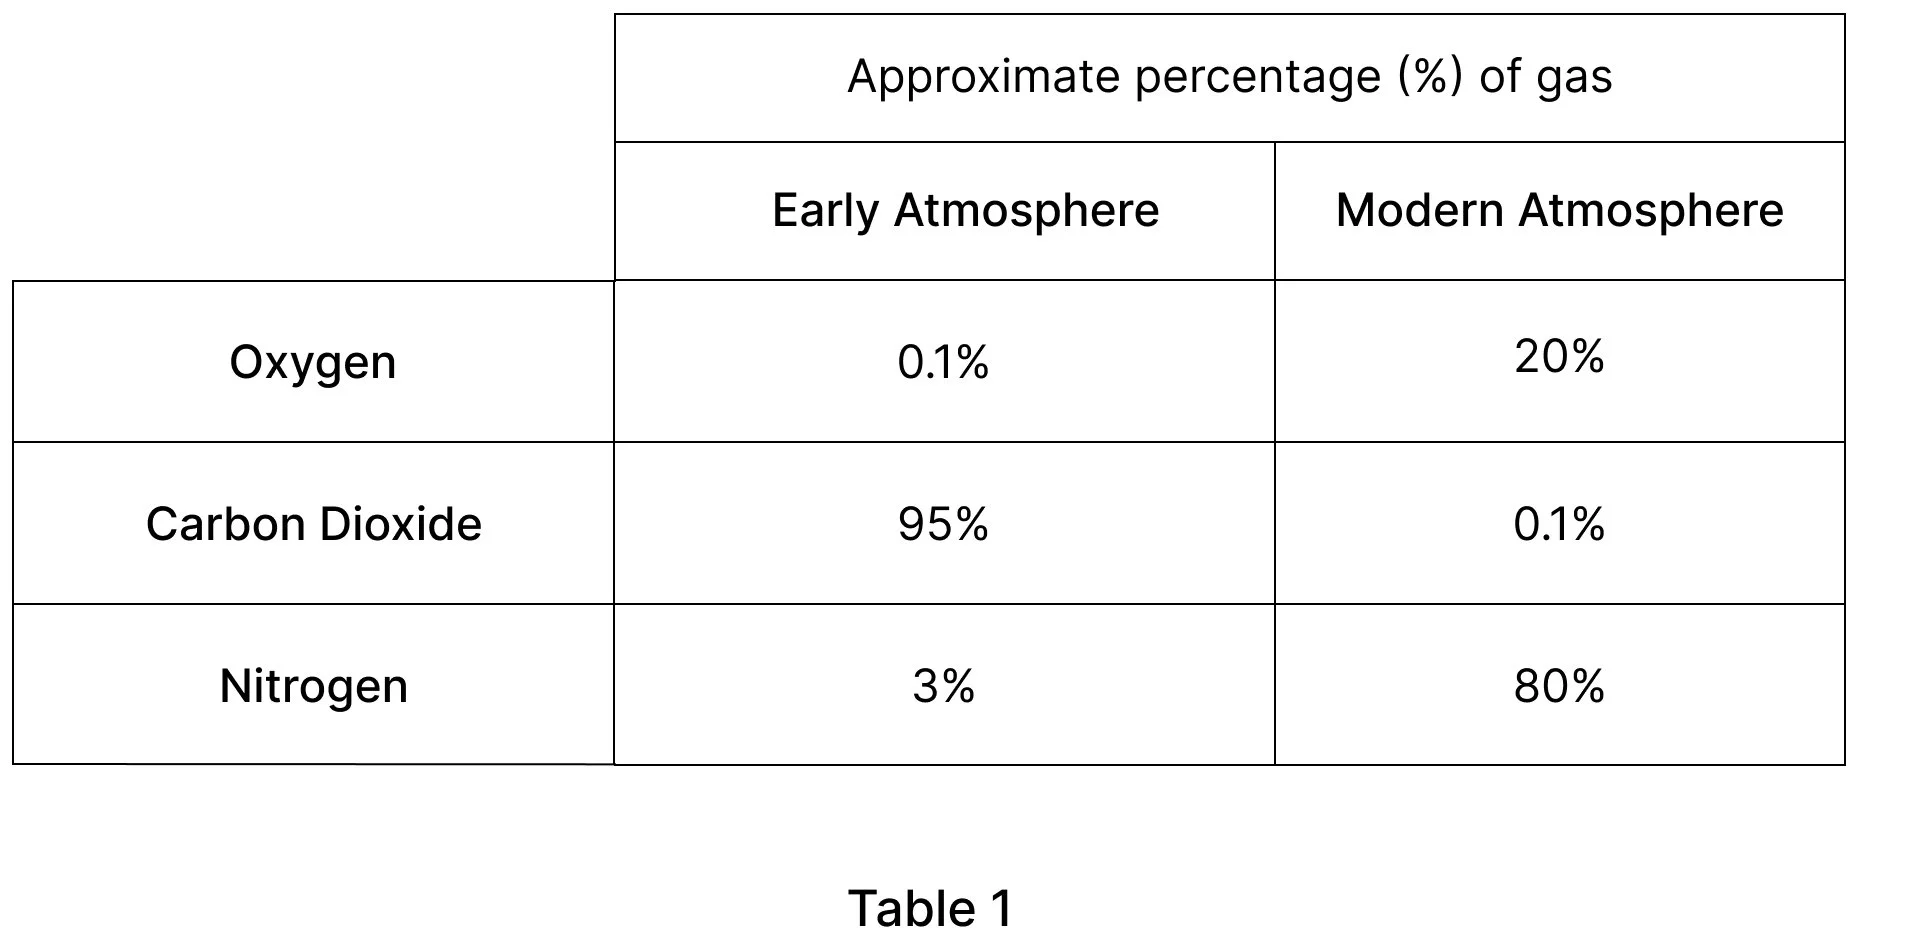
A chemistry exam question layout showing Table 1, which compares the approximate percentages of oxygen, carbon dioxide, and nitrogen in Earth's early atmosphere versus the modern atmosphere

*Explain = tell us HOW or WHY these changes happened

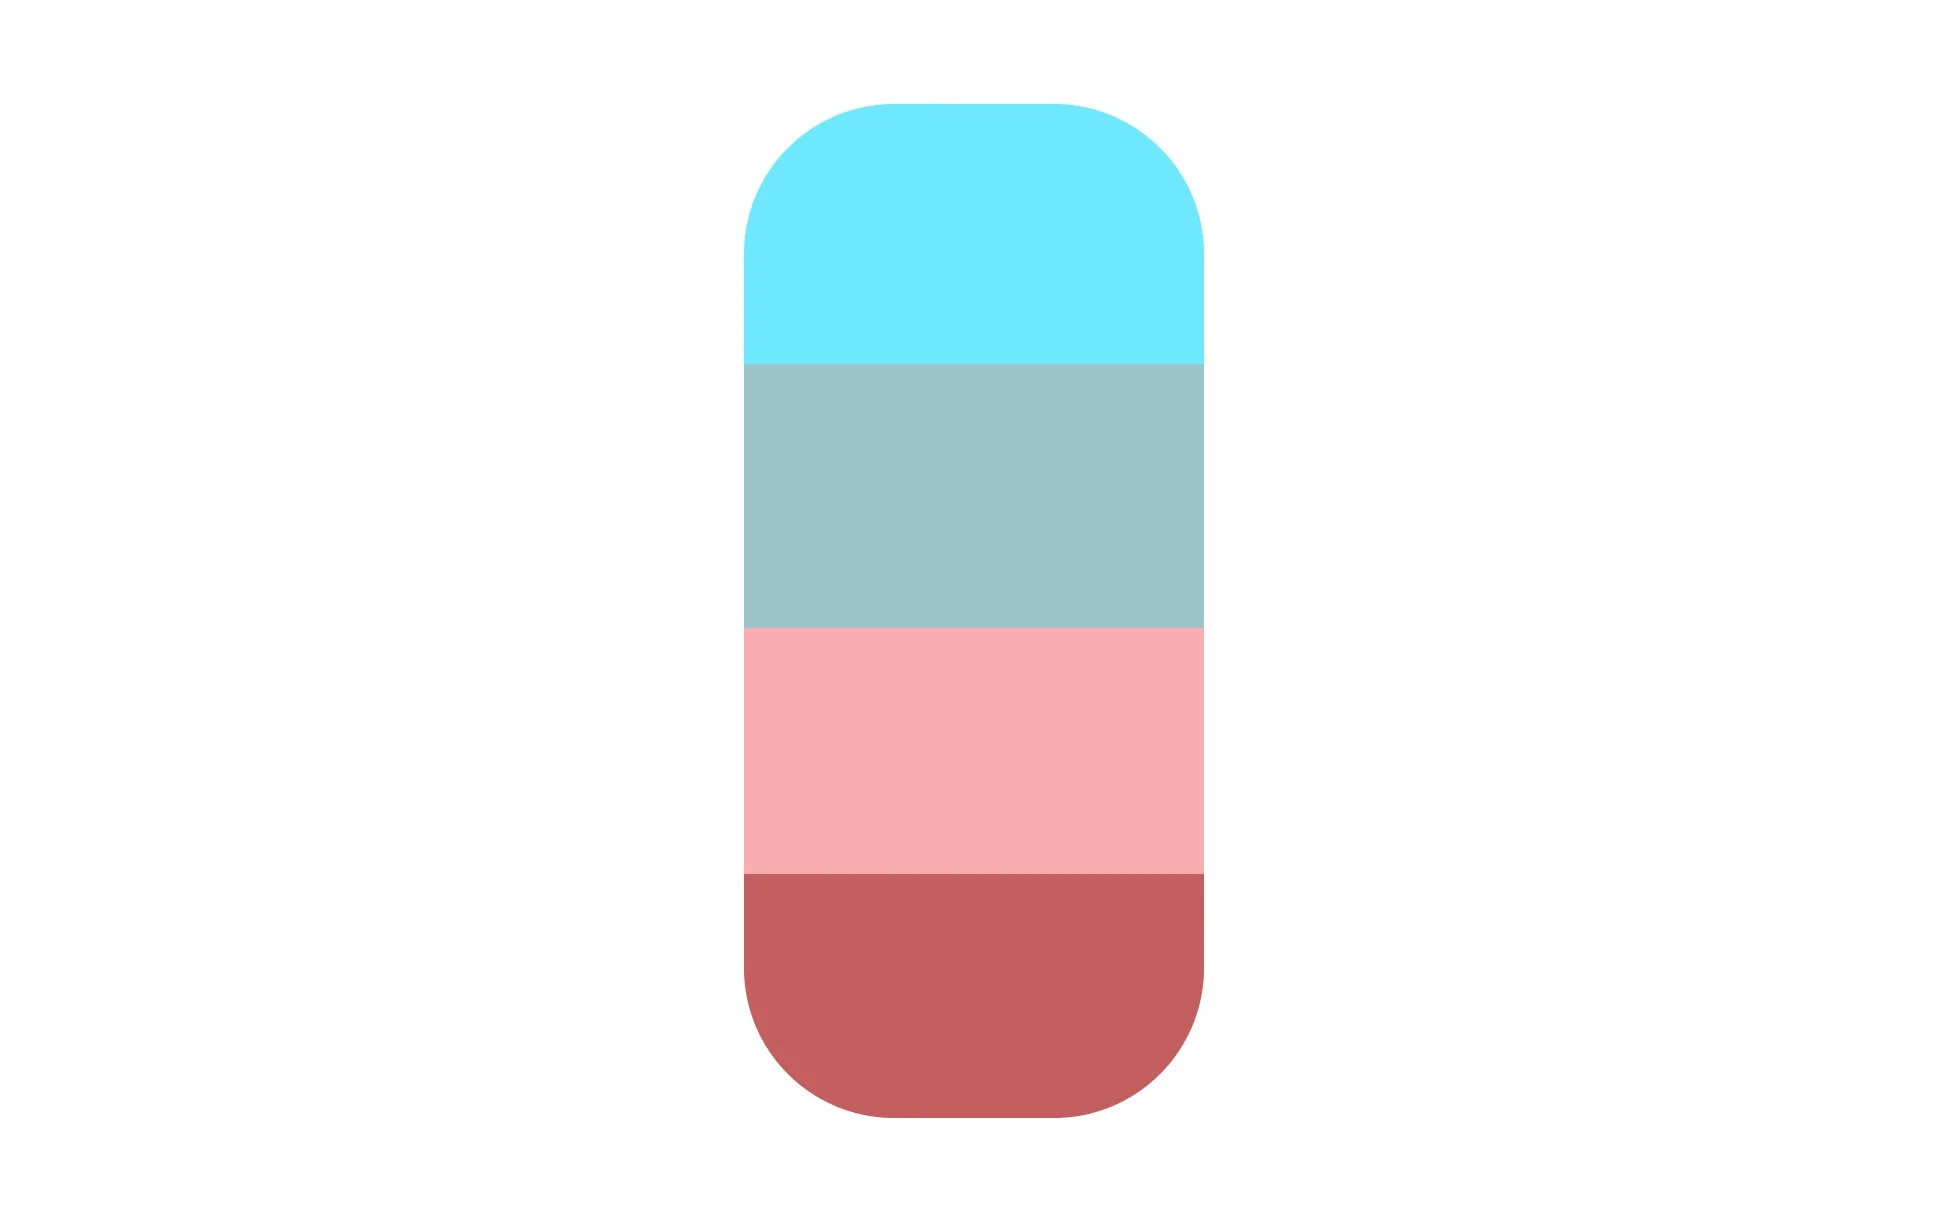
Table 1 with rows highlighted in color: oxygen in blue, carbon dioxide in pink, and nitrogen in teal, asking students if each gas increased or decreased.
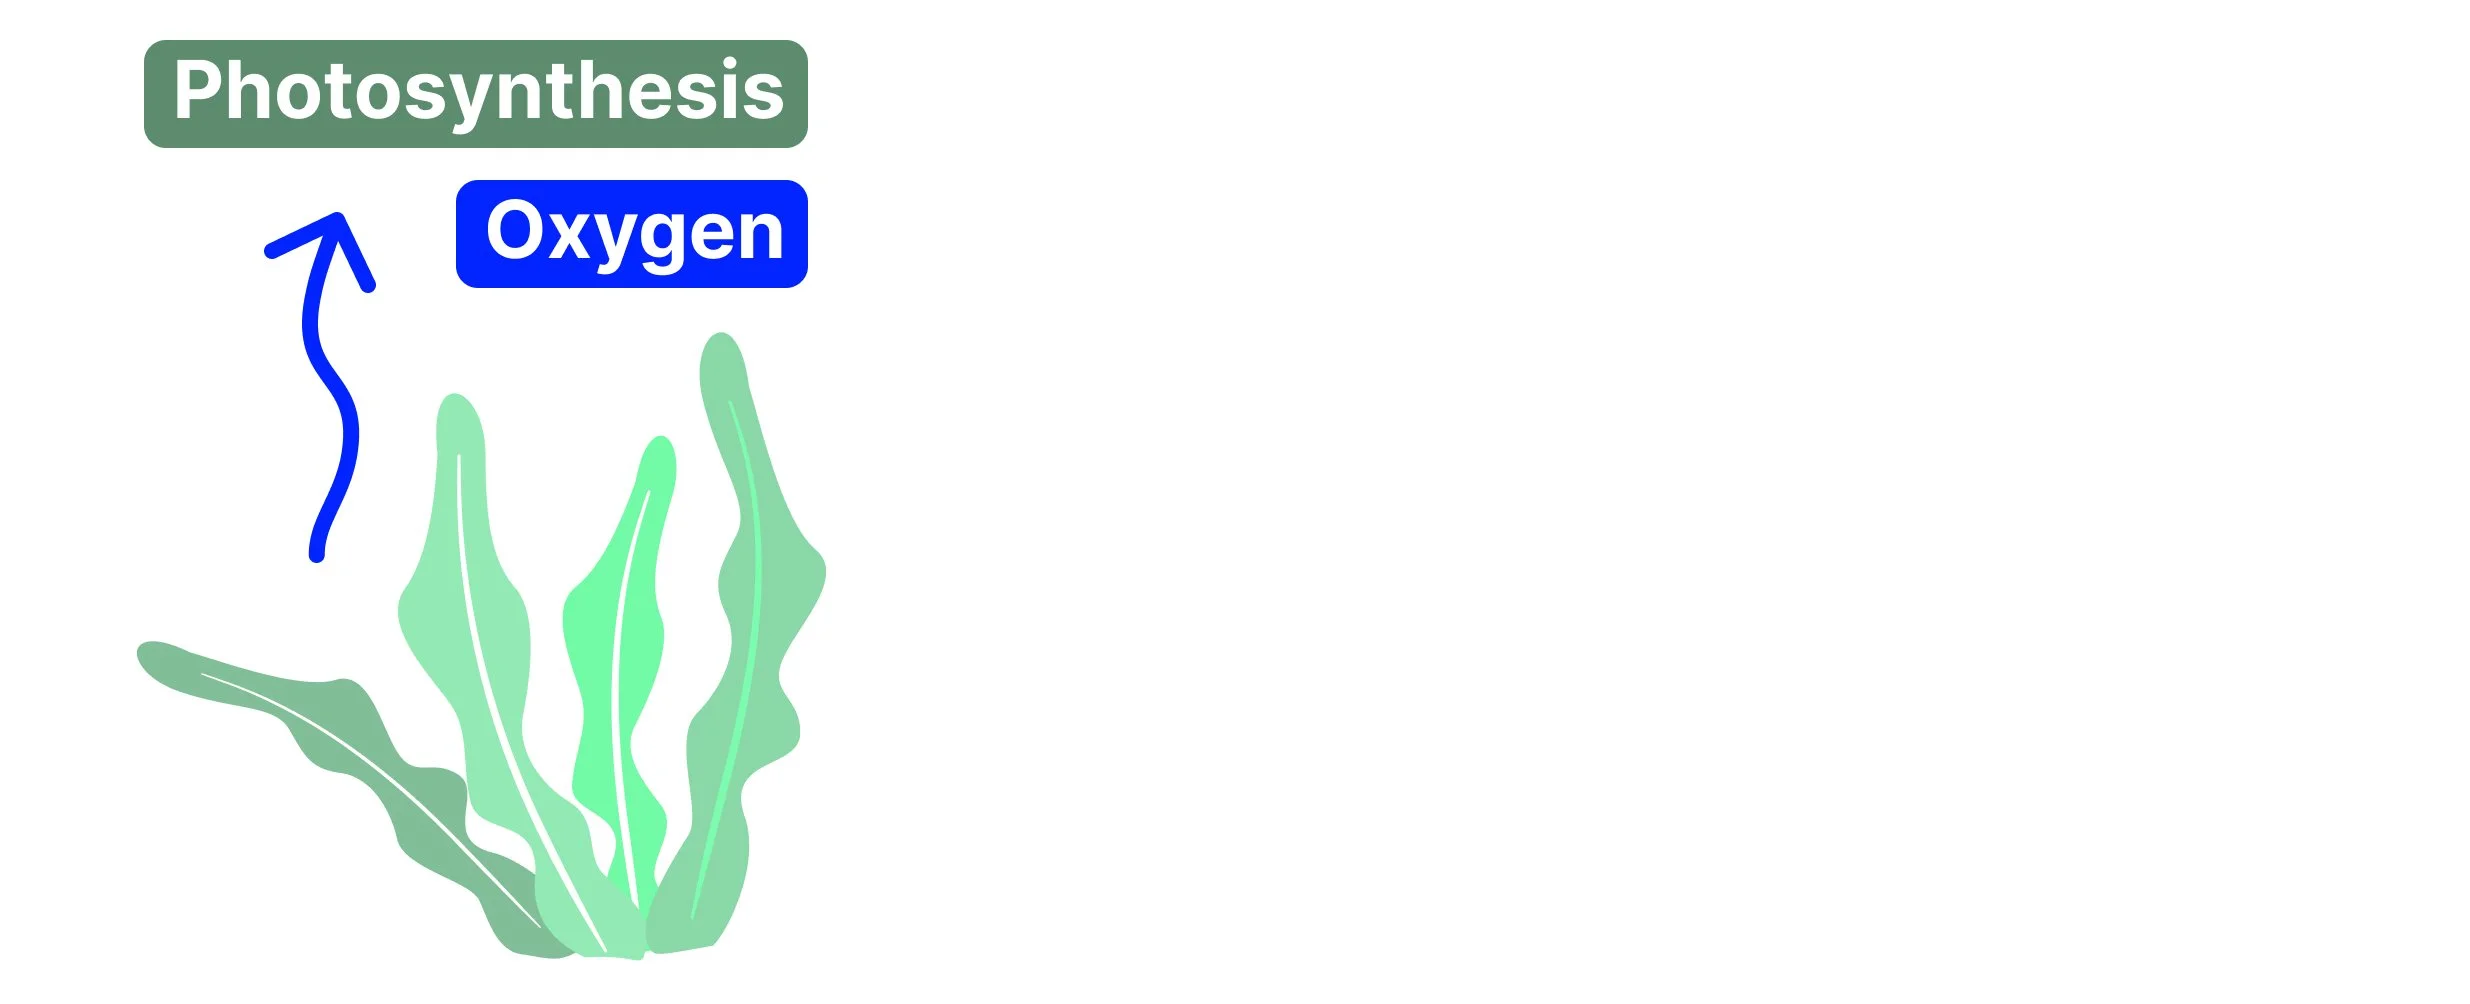
A minimalist vector diagram of green aquatic algae performing photosynthesis, with a blue arrow showing the release of oxygen gas into the atmosphere.
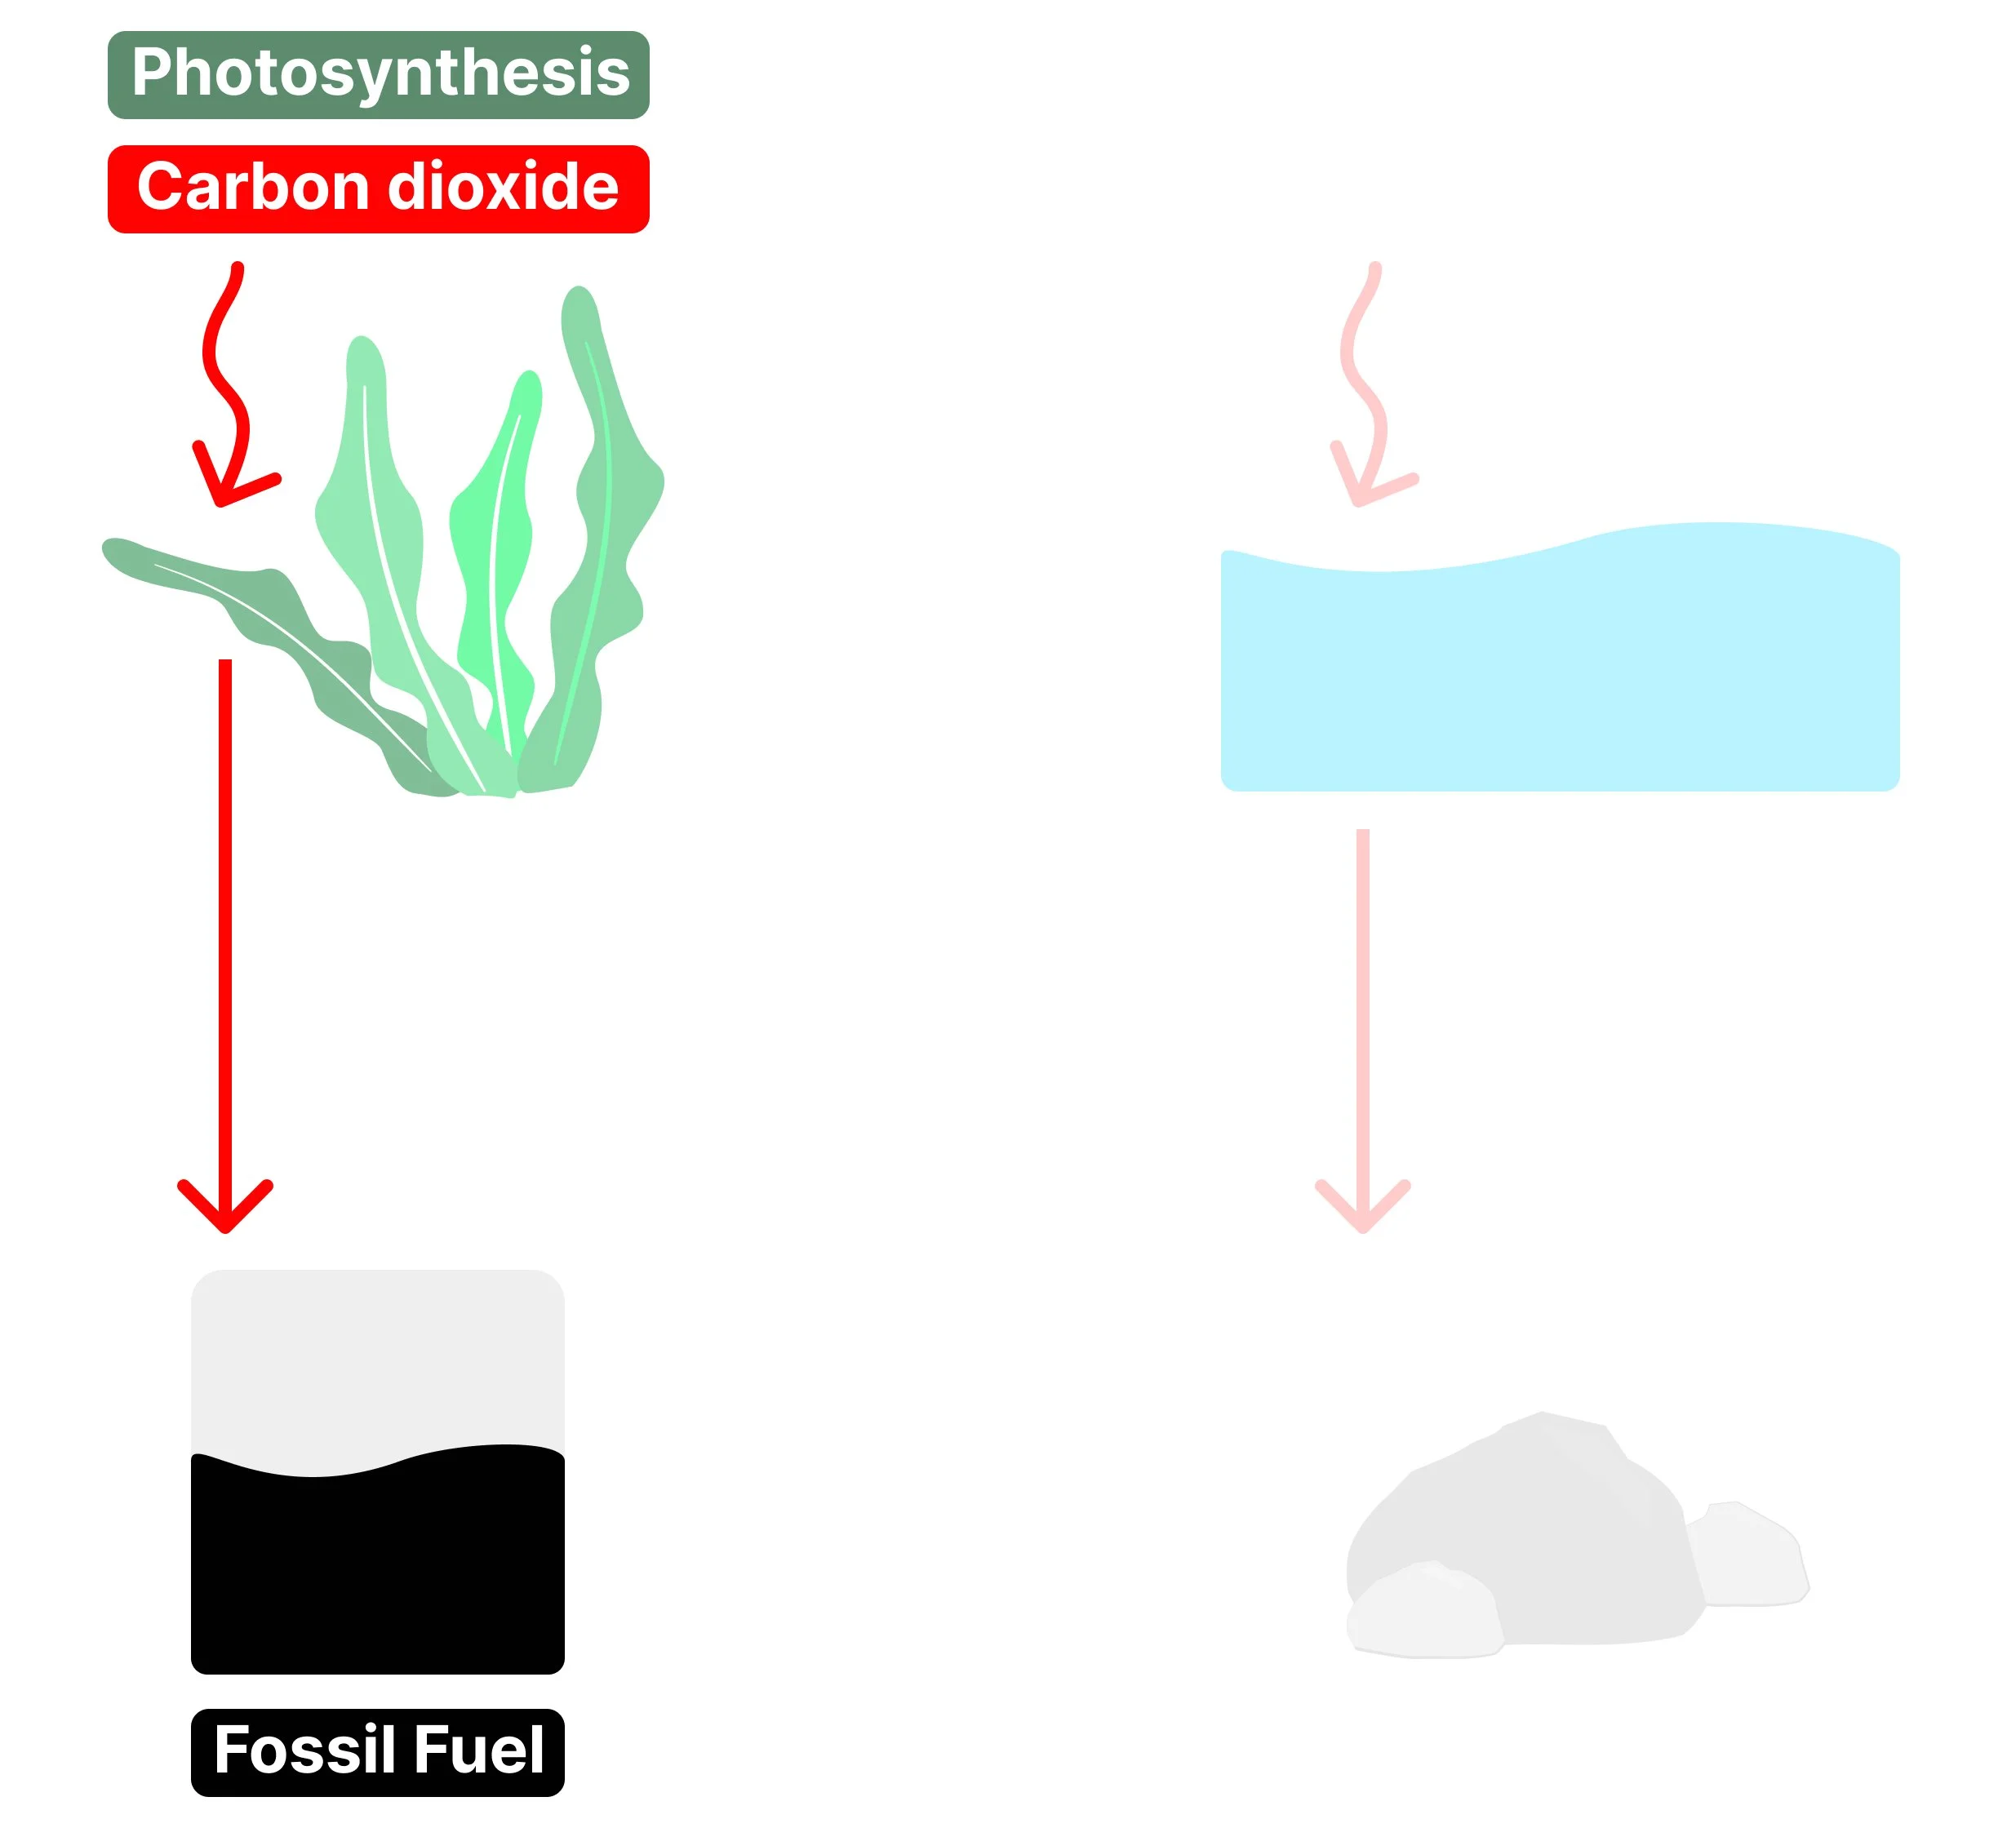
A vector illustration showing a green plant absorbing carbon dioxide, with a red arrow pointing down to a layer of black fossil fuels, demonstrating how carbon became locked away over millions of years.
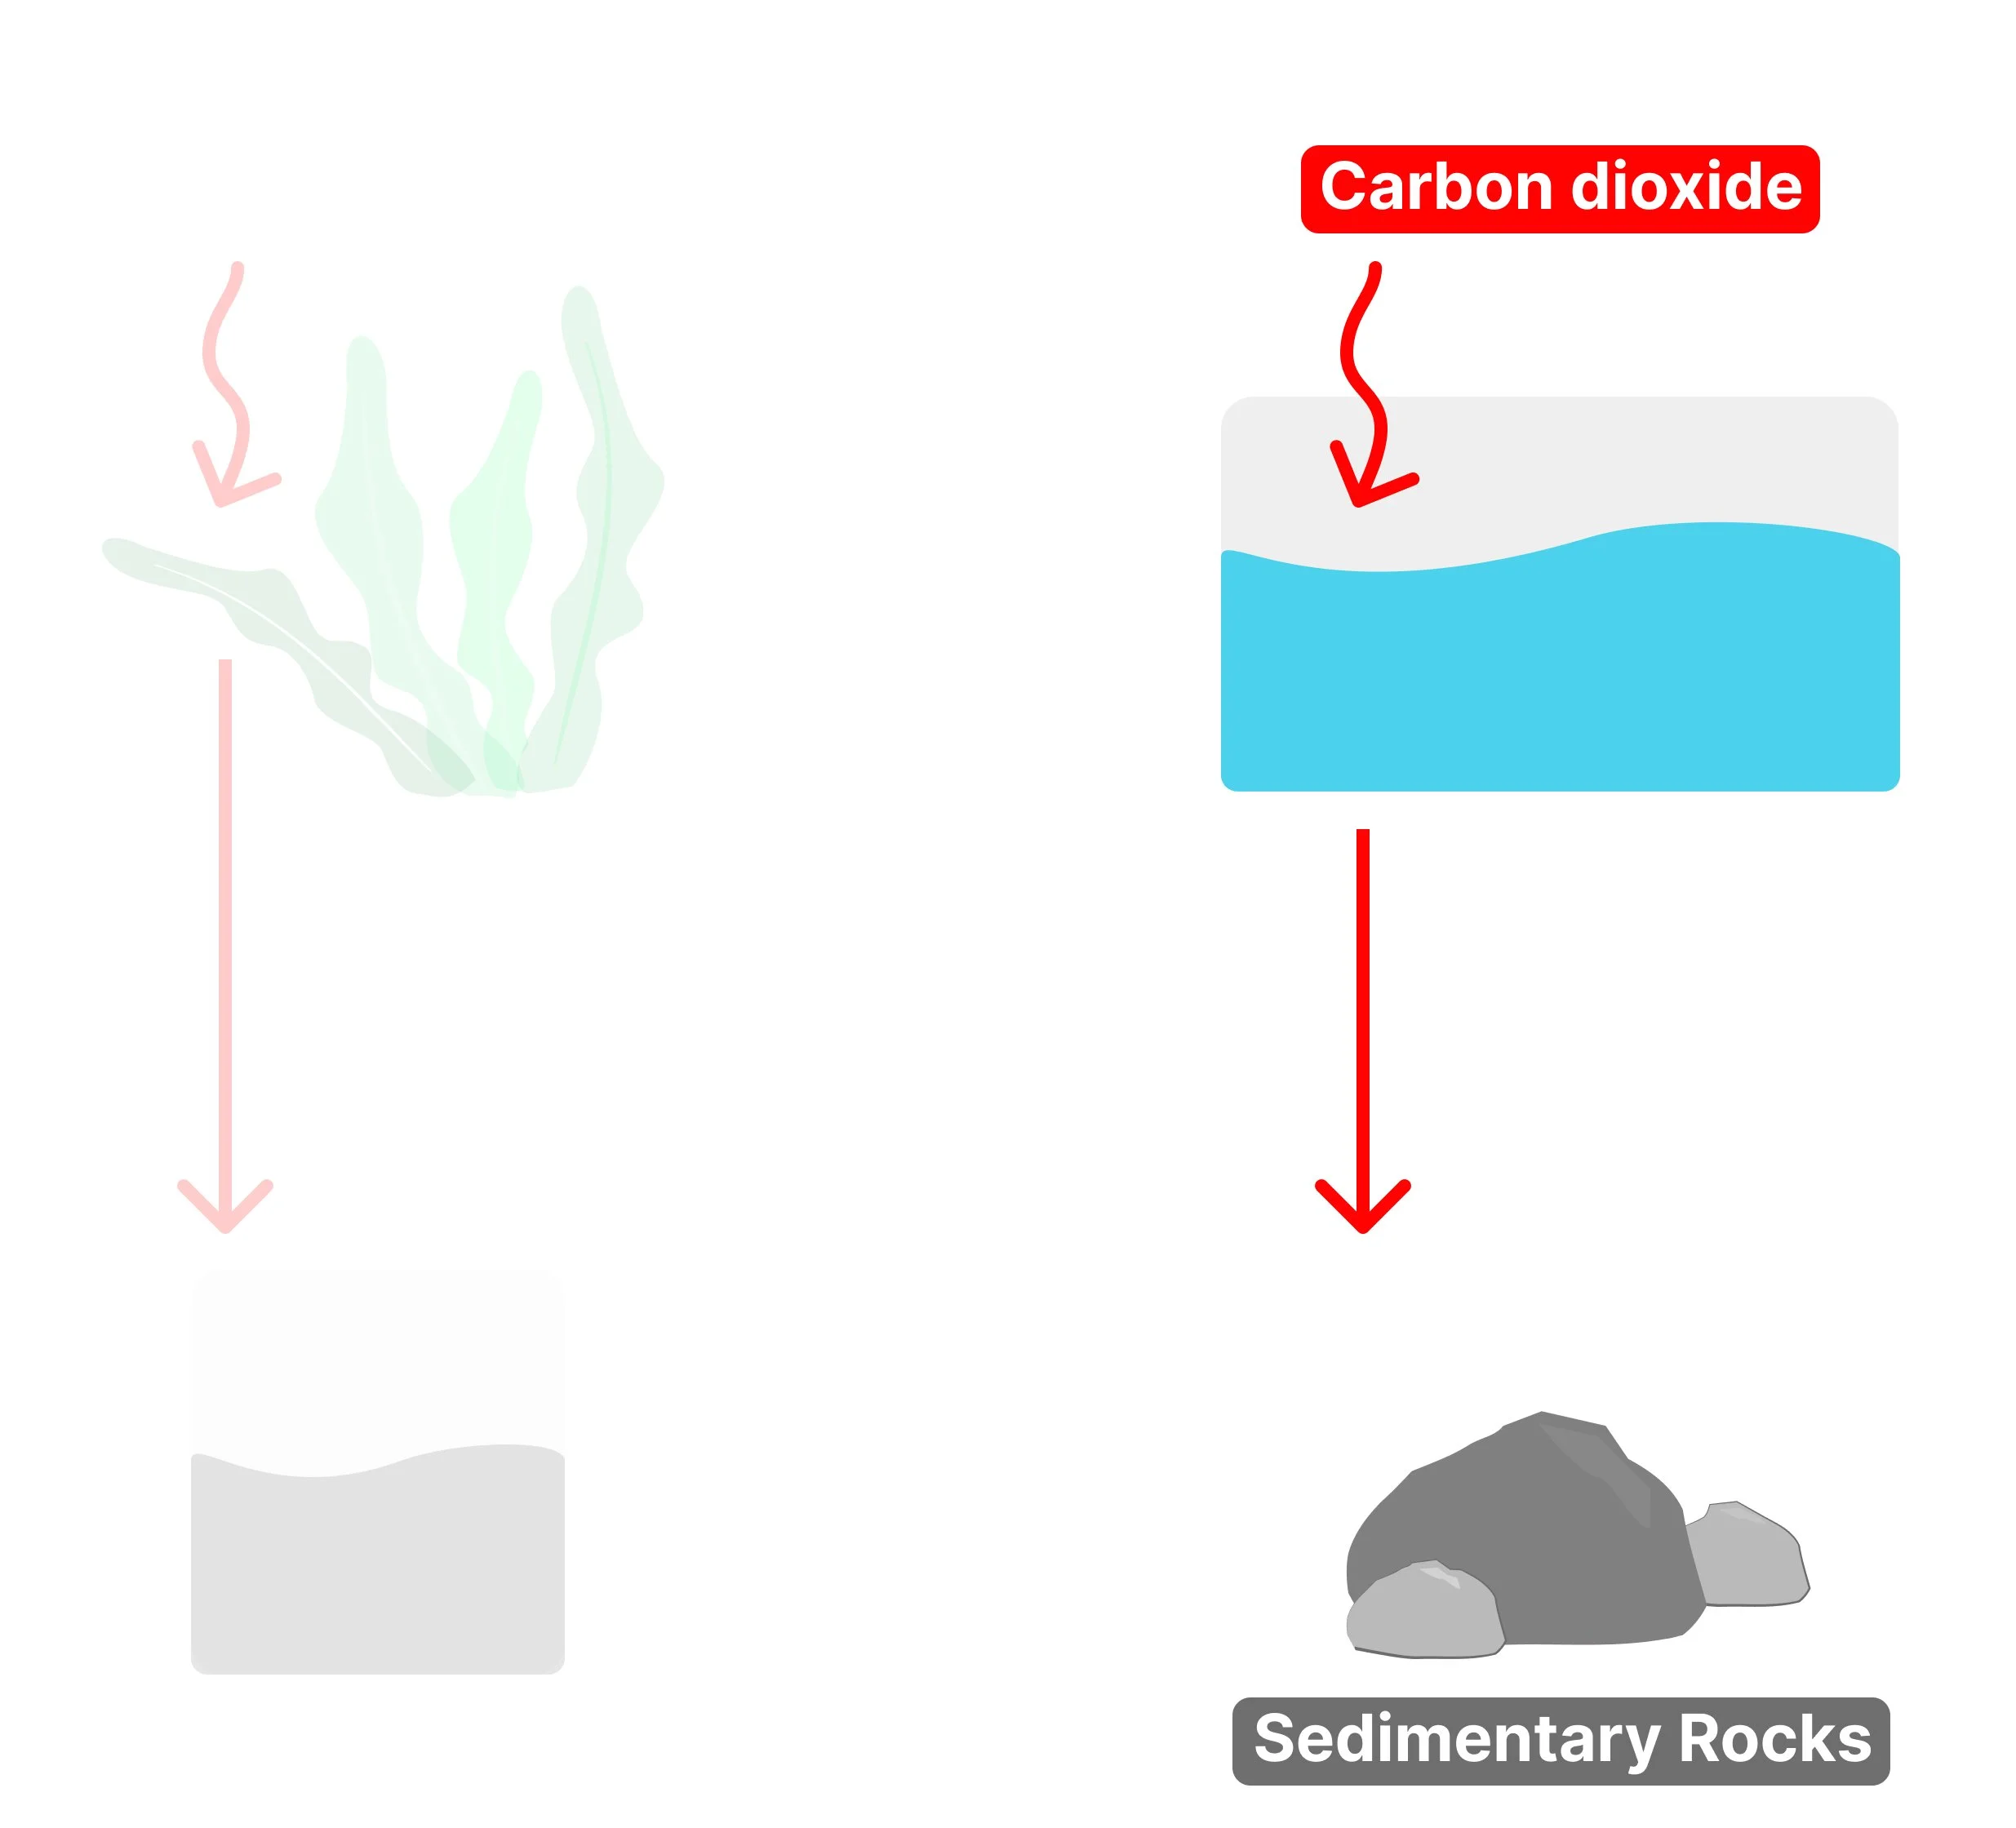
A vector diagram showing carbon dioxide dissolving into a blue body of water and a red arrow pointing down to grey sedimentary rocks, illustrating carbonate precipitation.
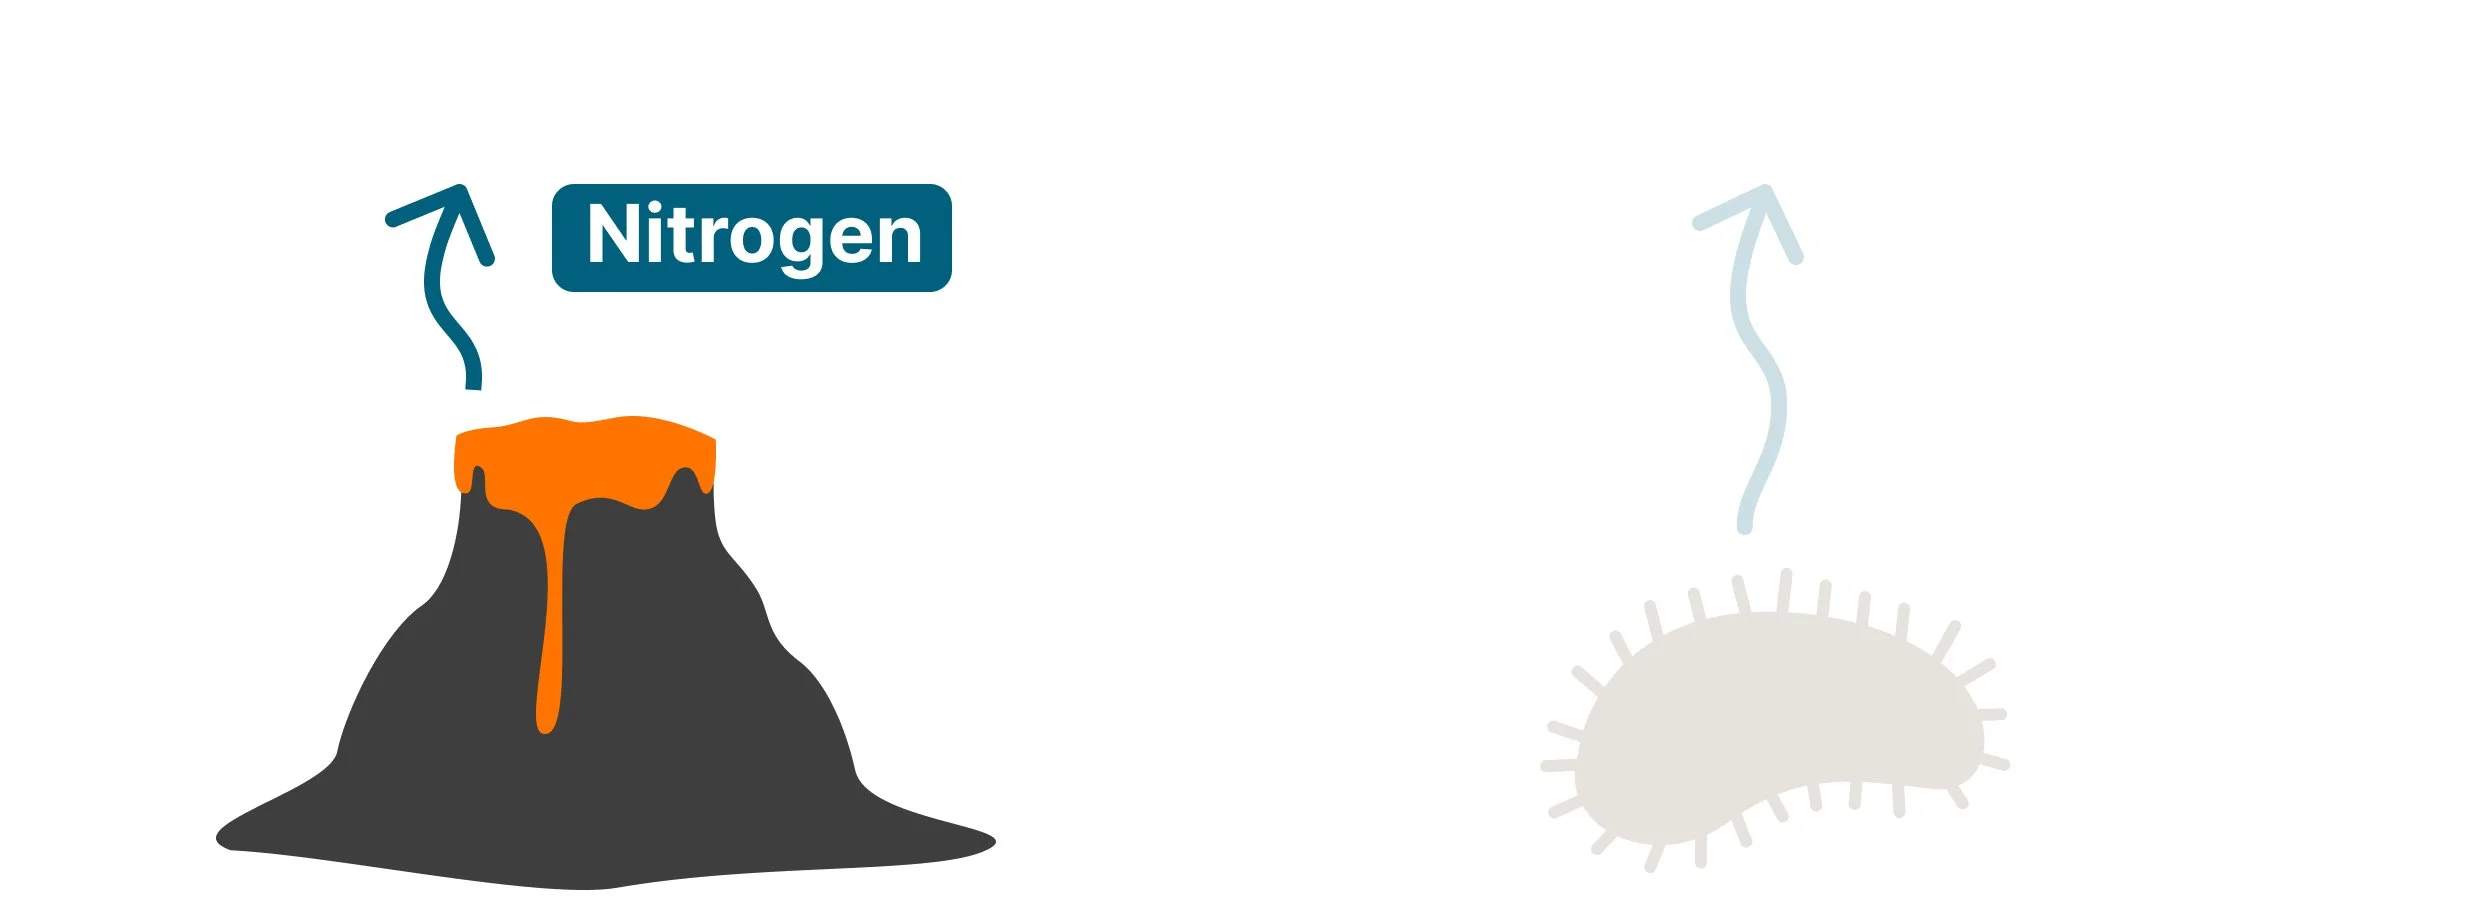
A vector illustration of a grey volcano erupting with orange lava, showing a blue arrow indicating the release of nitrogen gas into the atmosphere. The adjacent bacteria graphic is faded out.
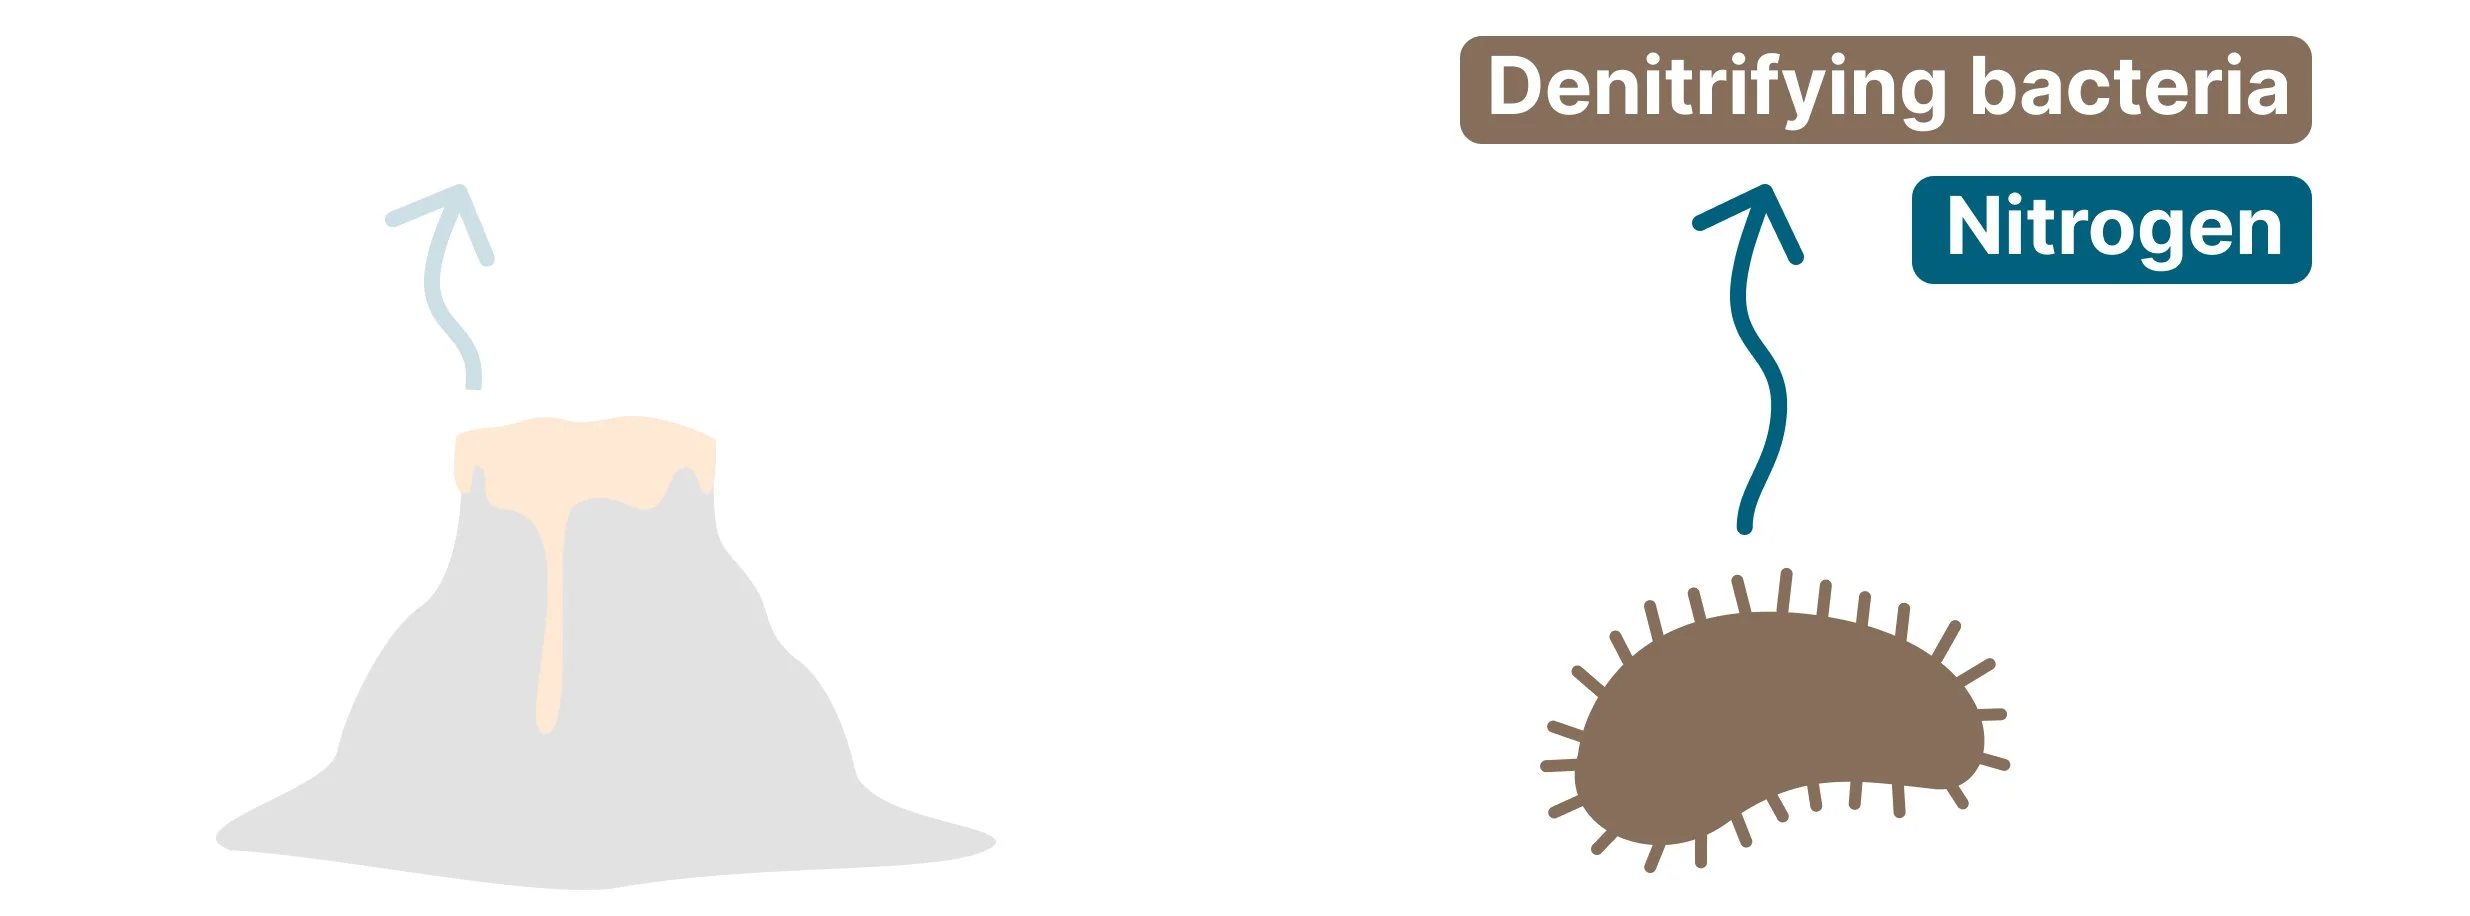
A vector diagram of a brown microbe labeled denitrifying bacteria with a blue arrow showing the production and release of nitrogen gas. The adjacent volcano graphic on the left is faded out.


Need help improving your GCSE Chemistry grade?

These visuals are created by our experienced GCSE tutors. Want personalised support?

Continue Revising Paper 2

Previous
Previous

Altering Factors - Particle Size

Next
Next

Temperature Changes - Required Practical 4