Life Cycle Assessment
Coffee shops serve drinks in containers made from either ceramics or a synthetic polymer.
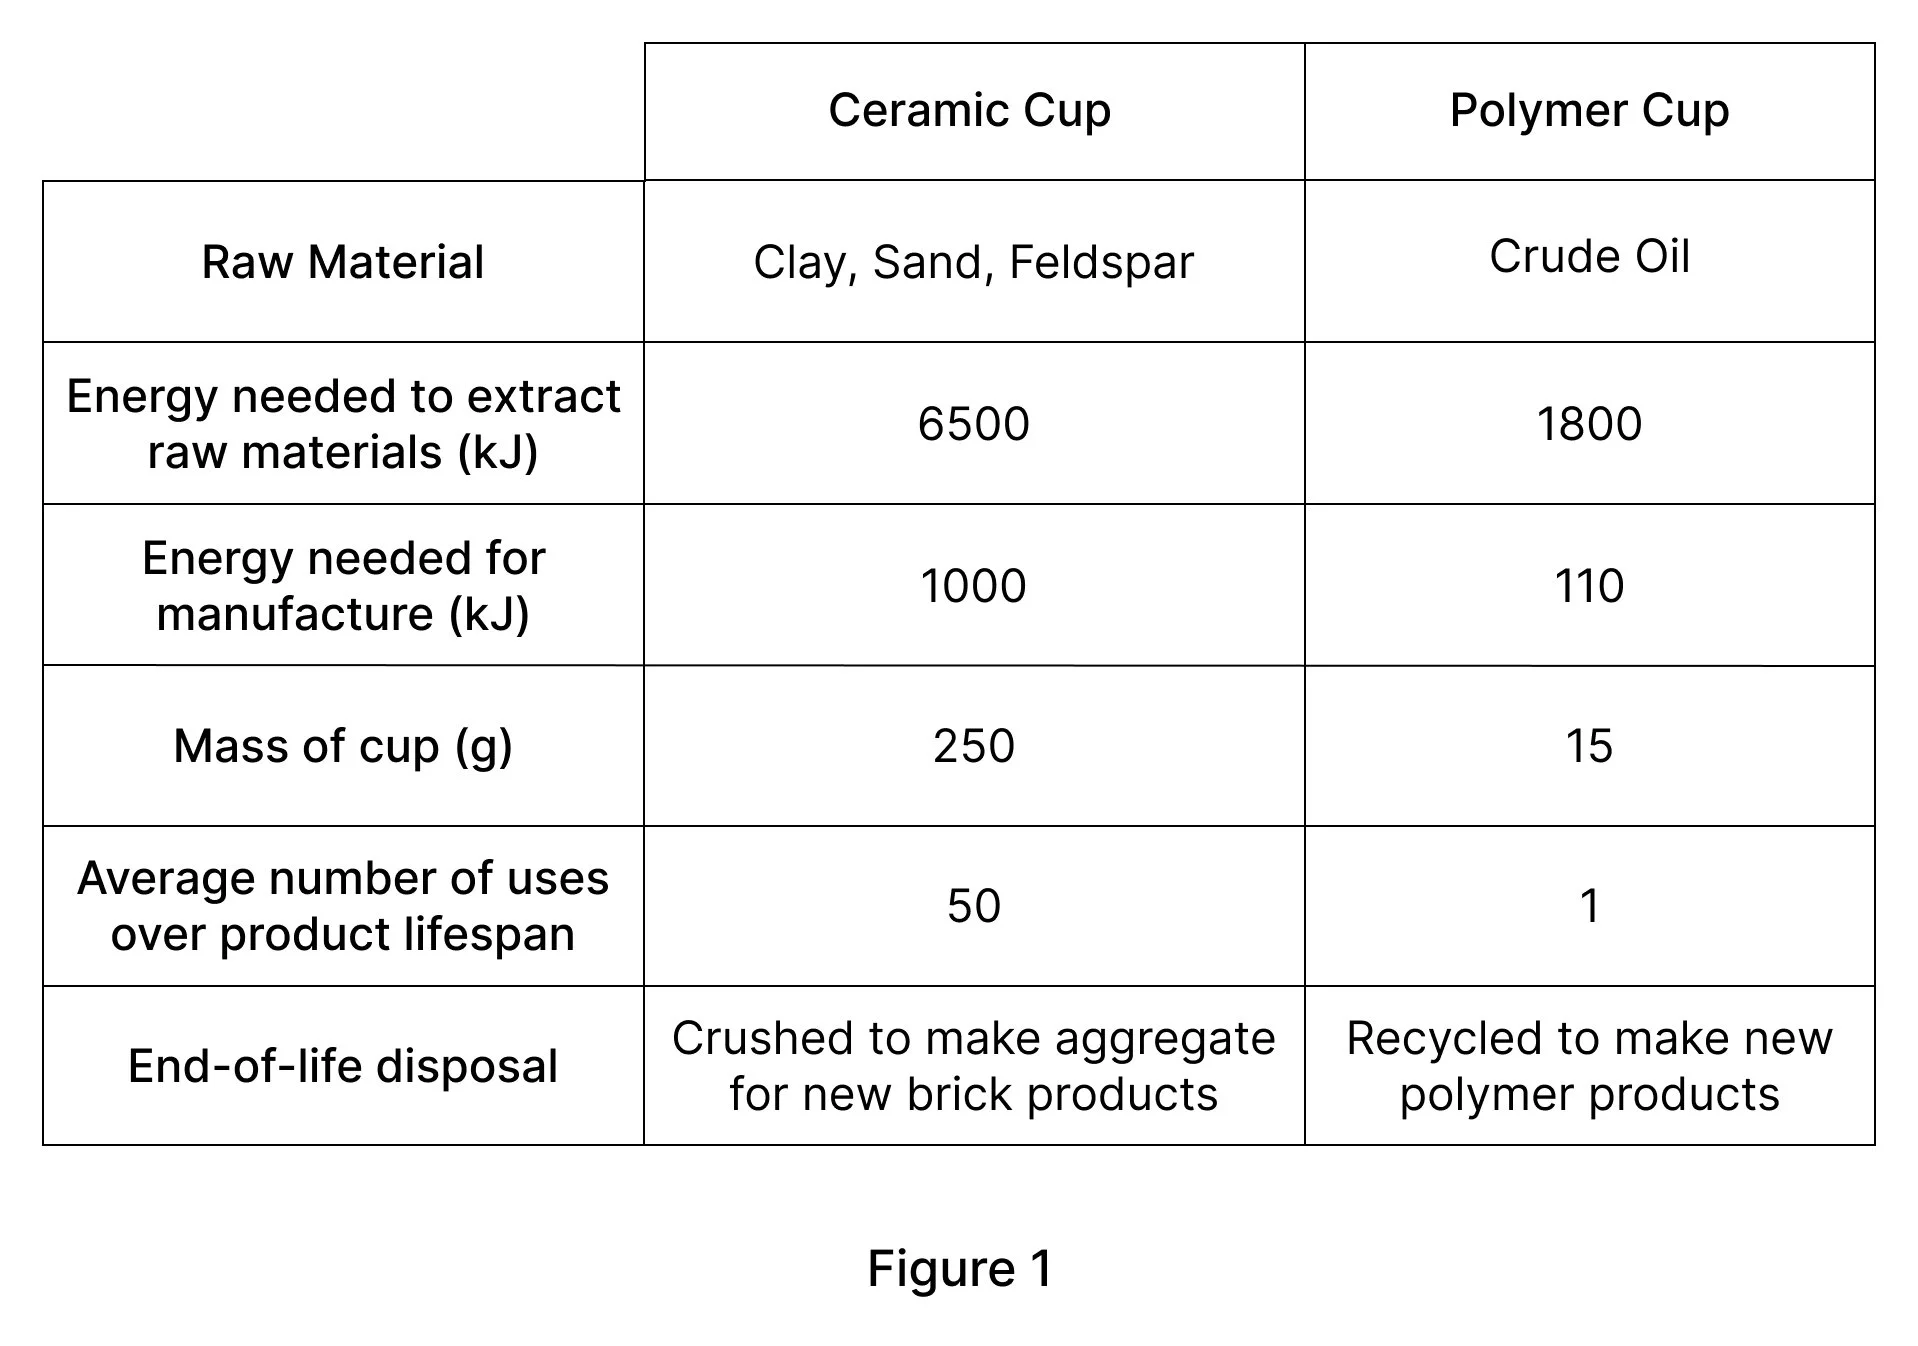
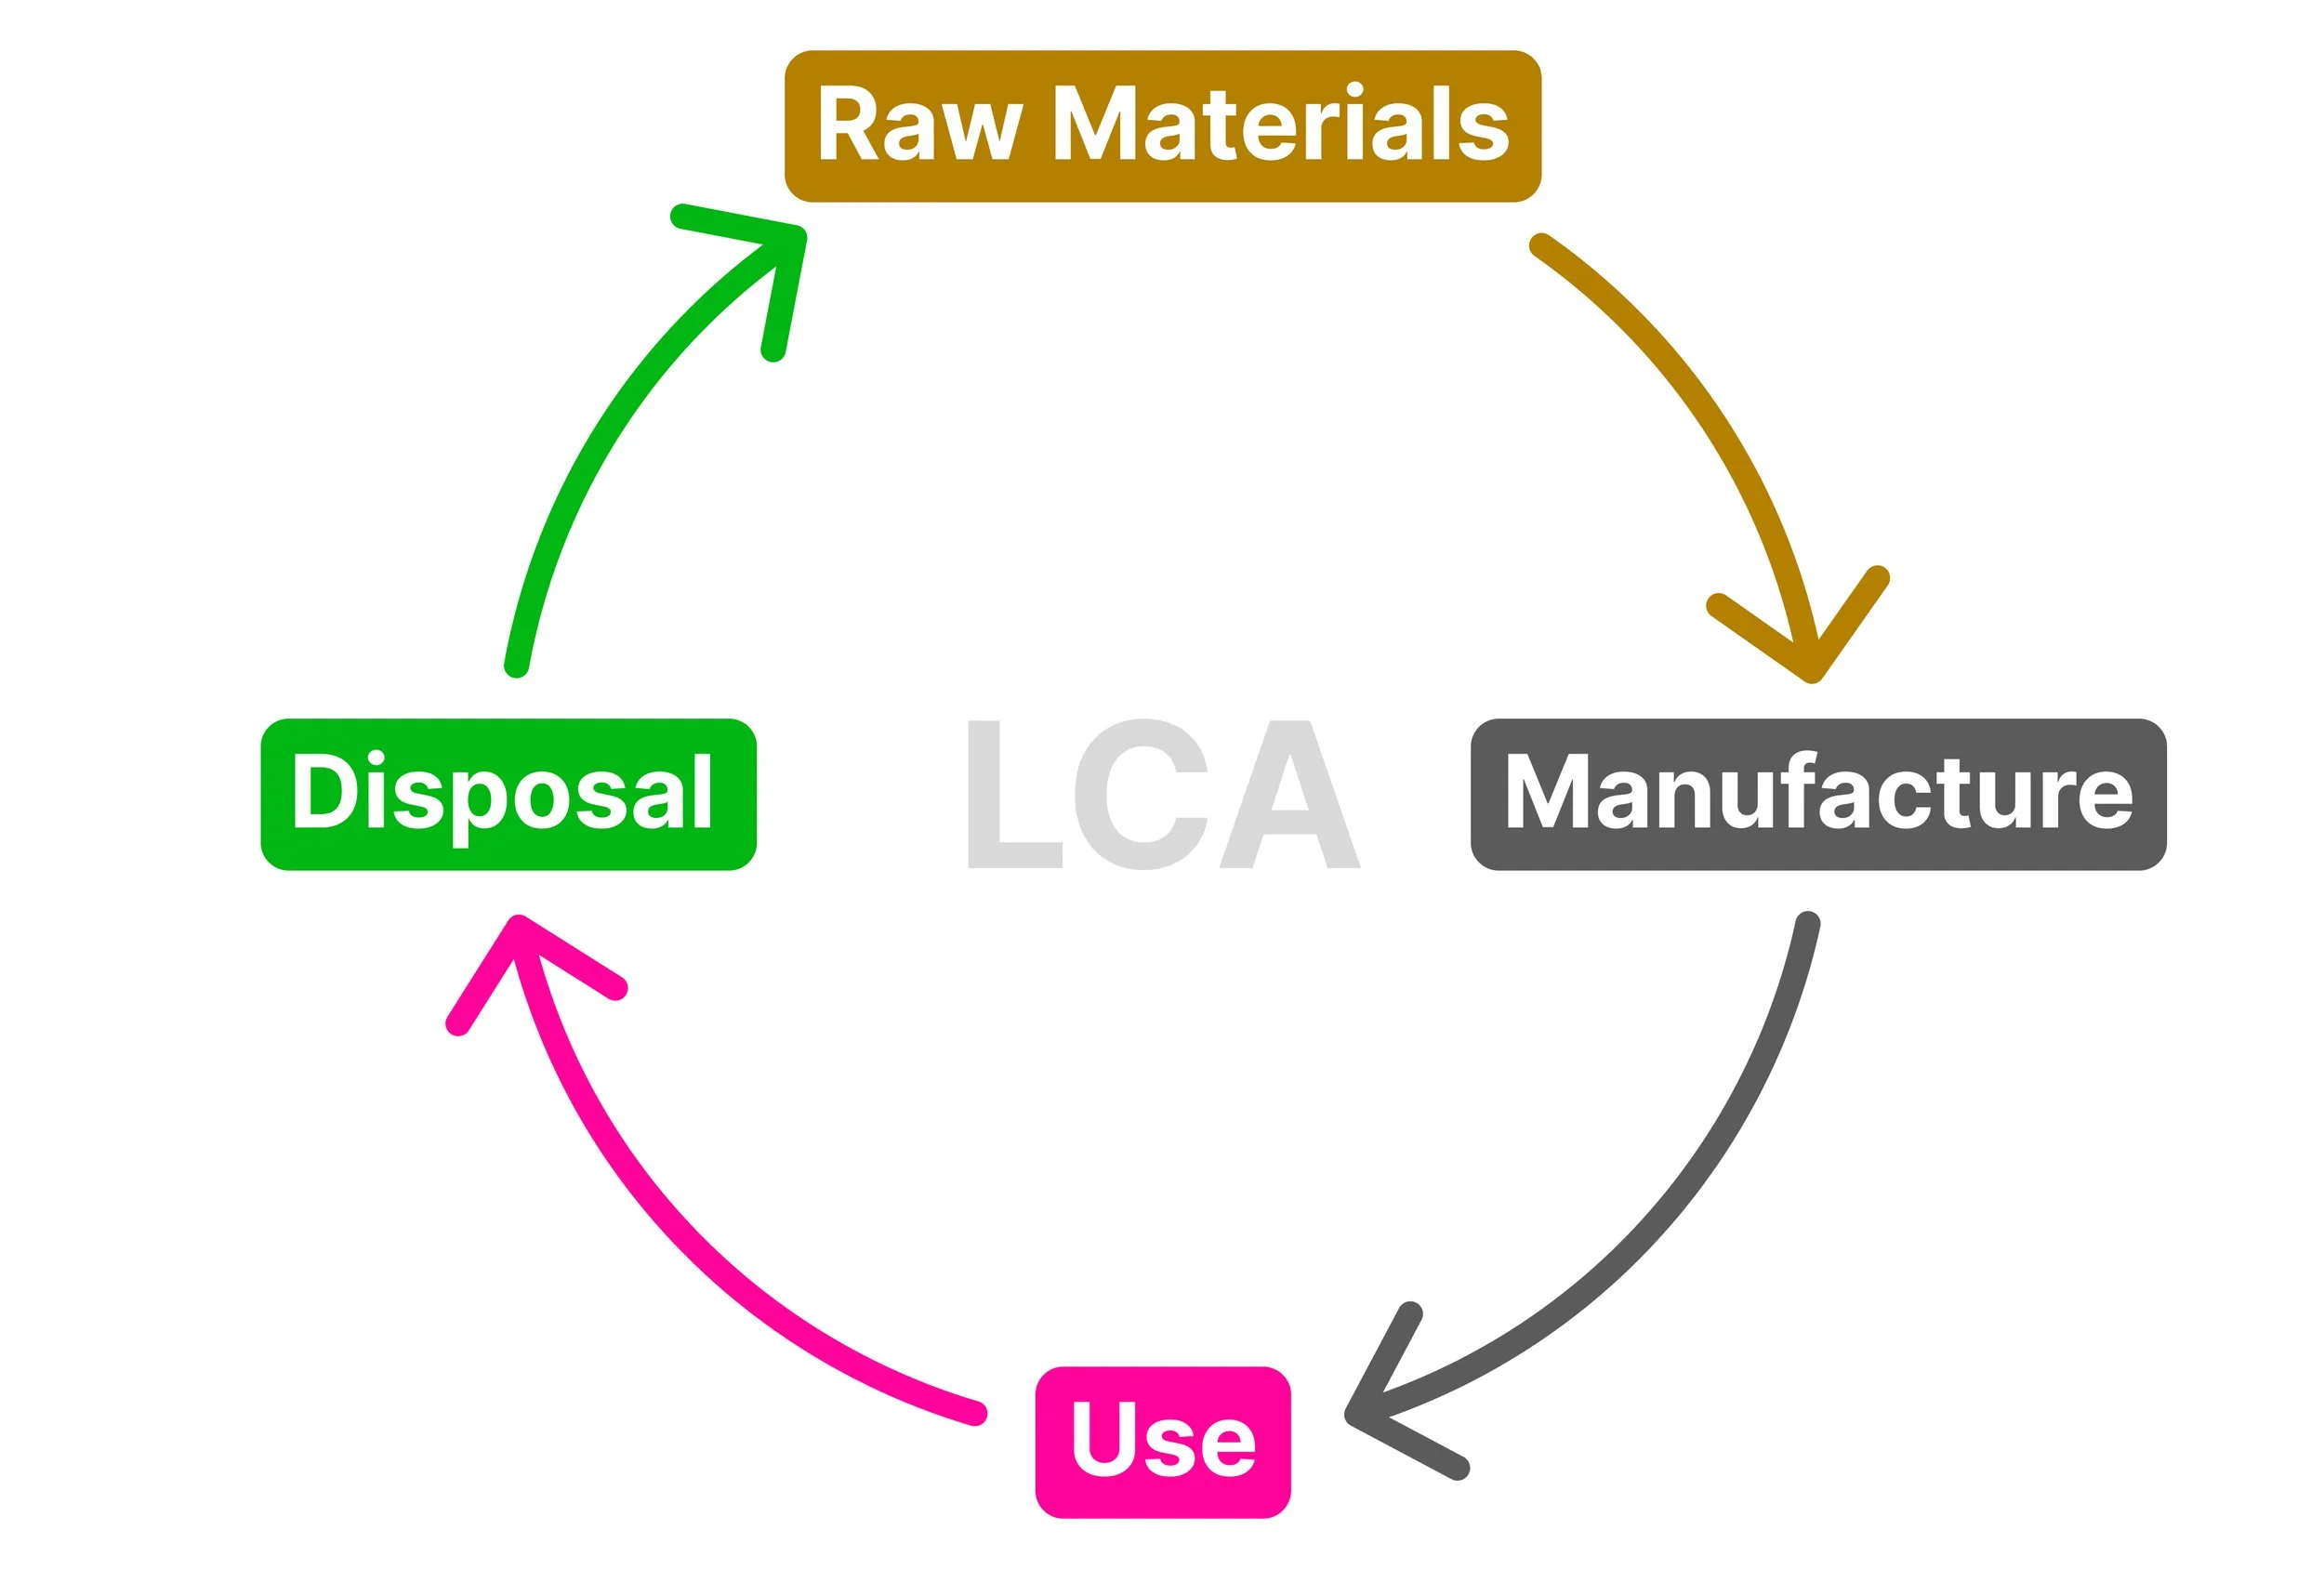
Evaluate the use of each. Refer directly to the stages of a life cycle assessment (LCA) and the data provided in Figure 1.
[6 marks]
-
Group 7 elements form small molecules. (1 marks)
Individual chlorine atoms are held in together in pairs with:
Strong covalent bonds
Different chlorine molecules are held together with:
Weak intermolecular forces
-
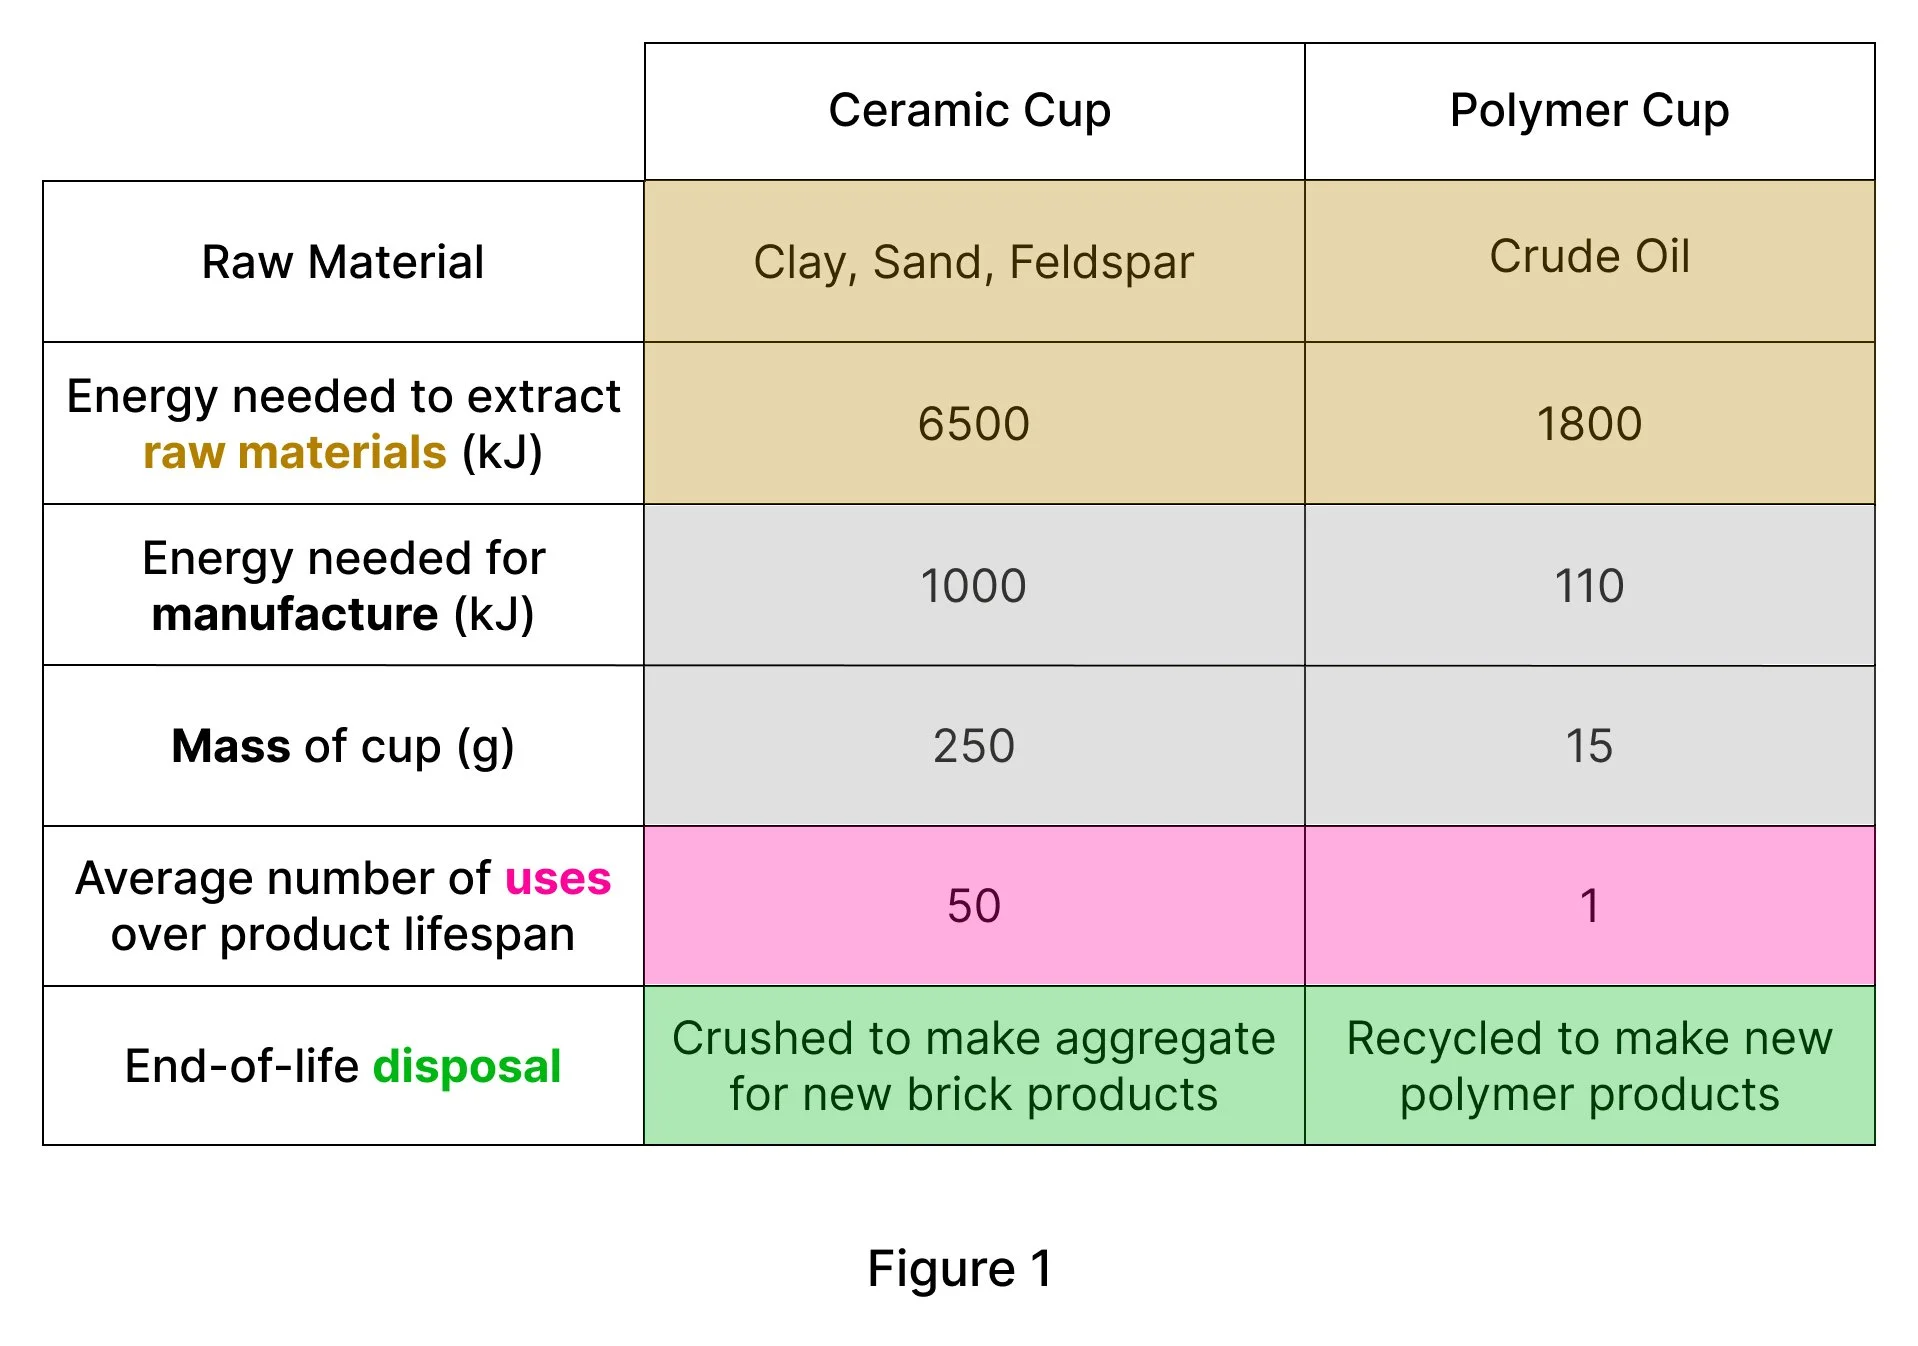
See highlights in Figure 1 below.
-
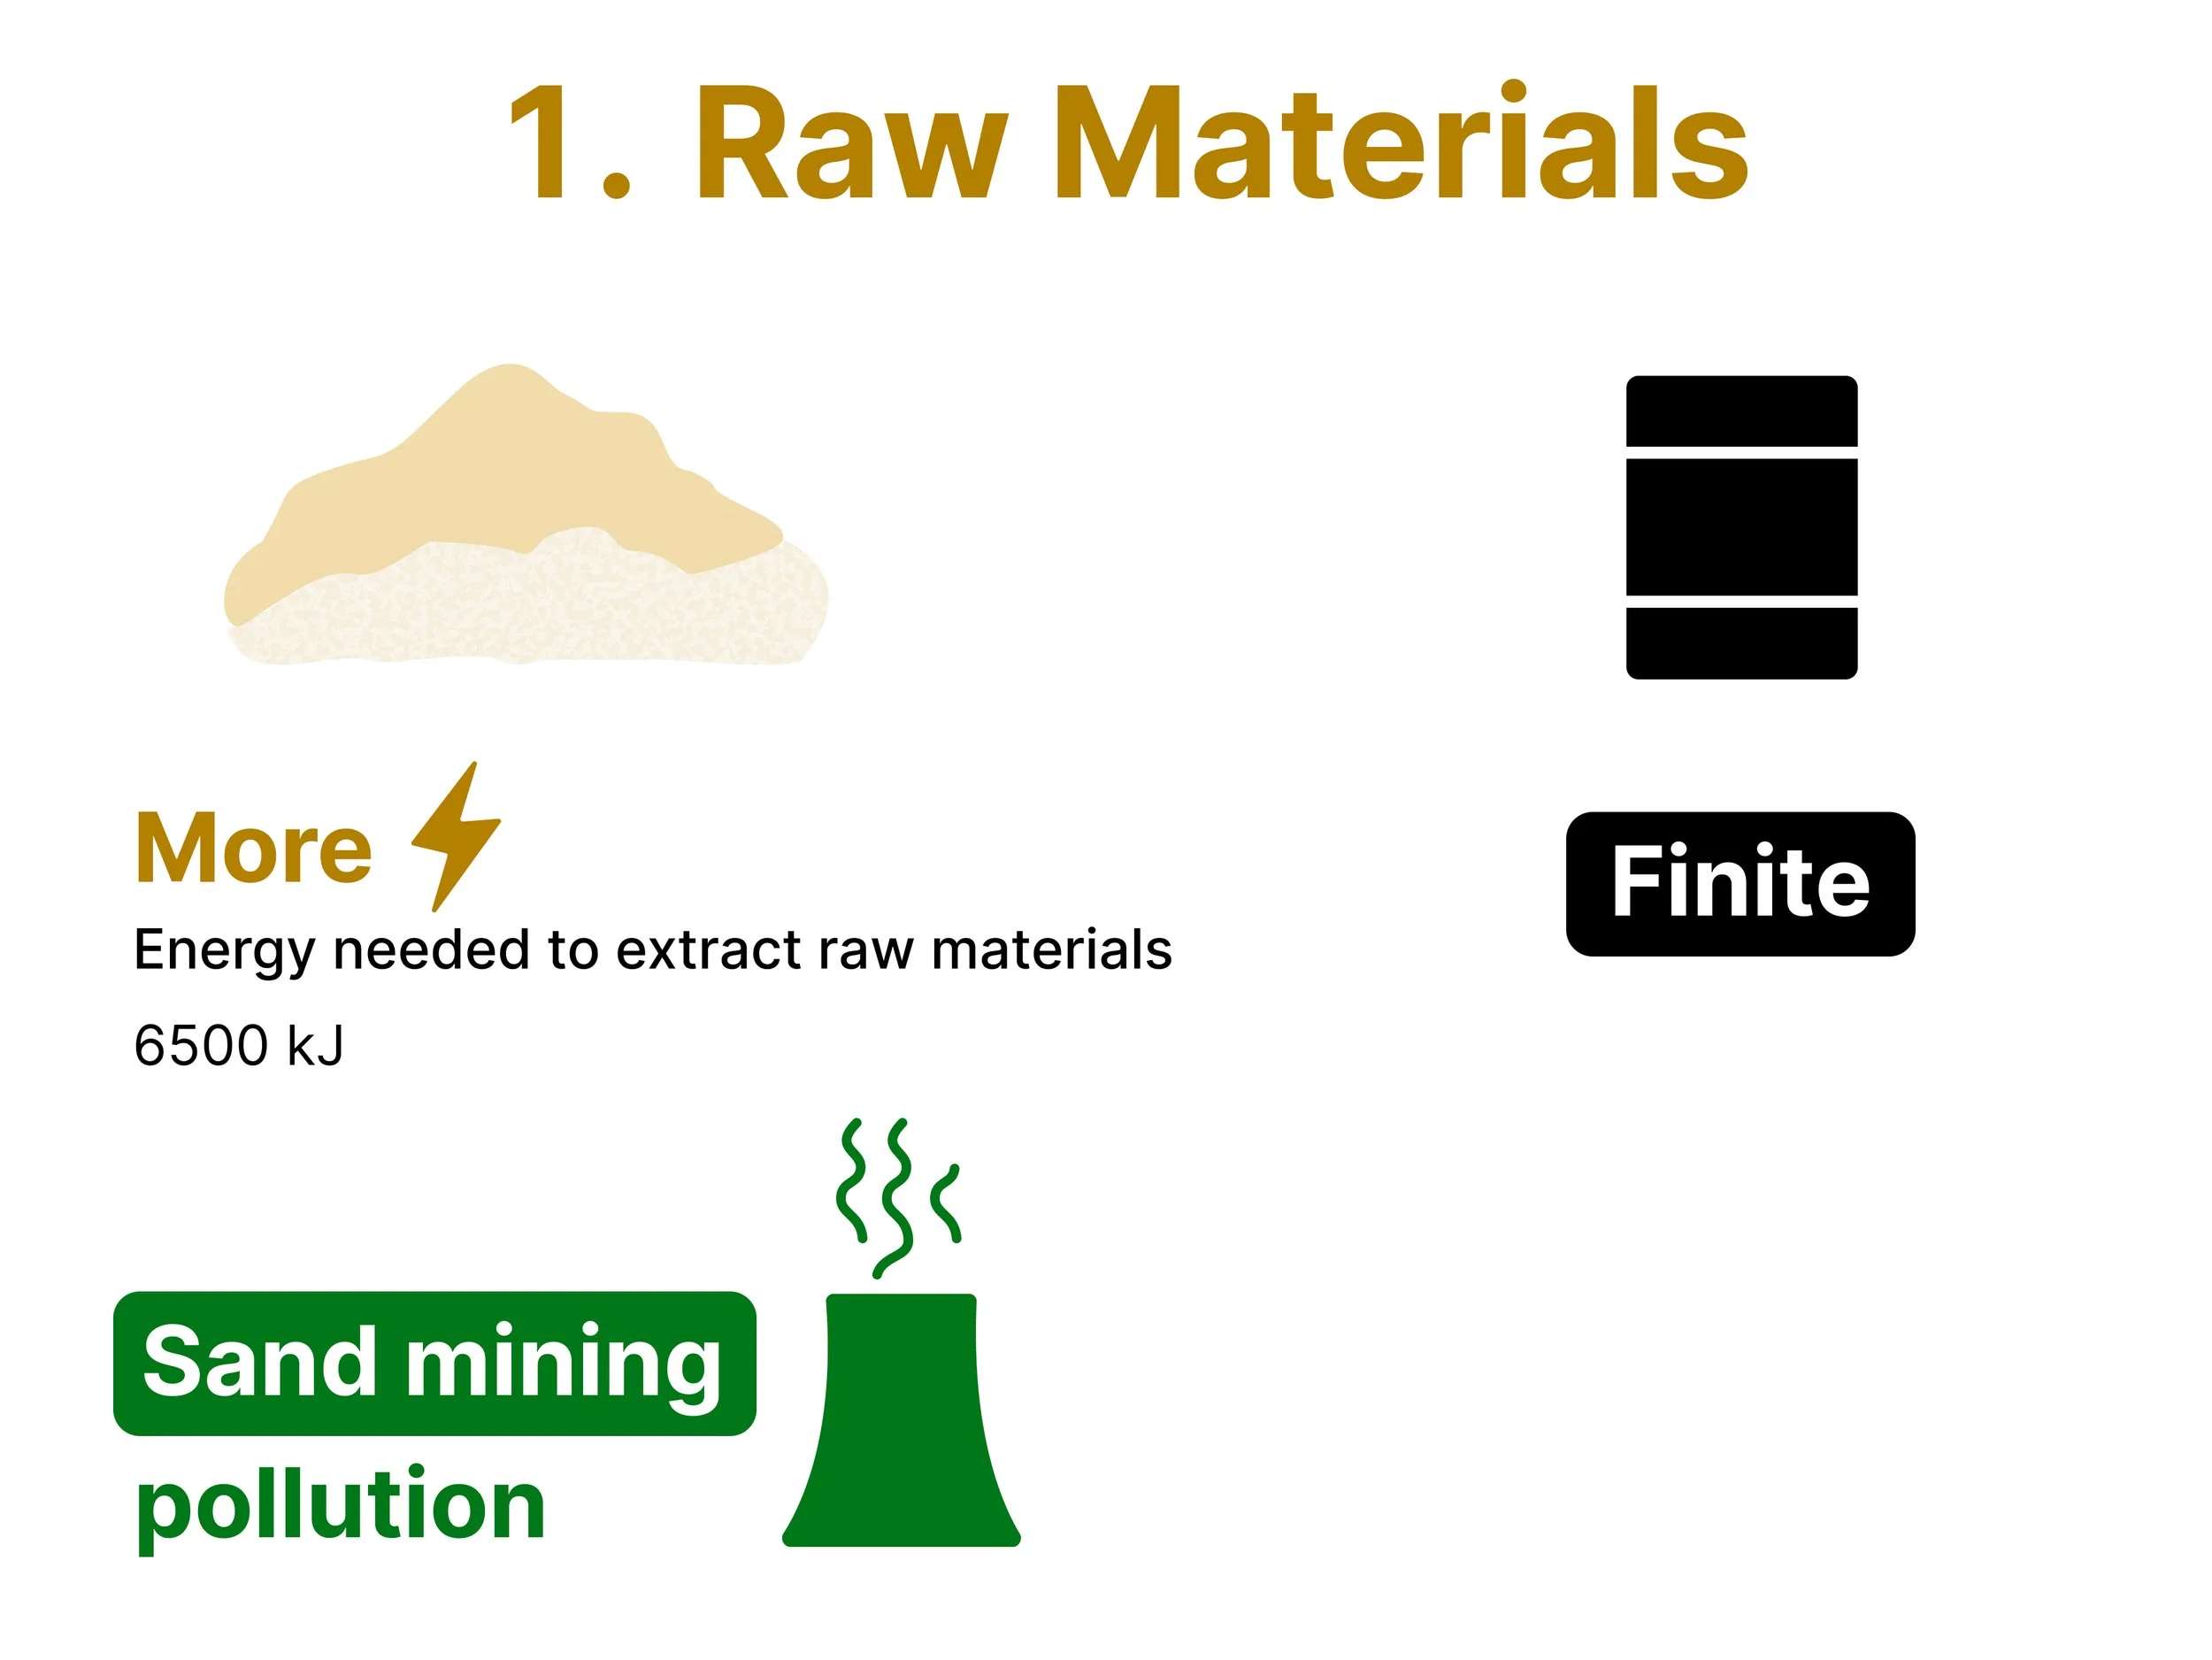
Ceramic needs more energy to extract (6500 kJ) from the table. (1 mark)
Raw material is sand which needs mining. This causes pollution. (1 mark)
For Polymer, crude oil is finite (runs out). (1 mark)
So higher melting and boiling points.
-
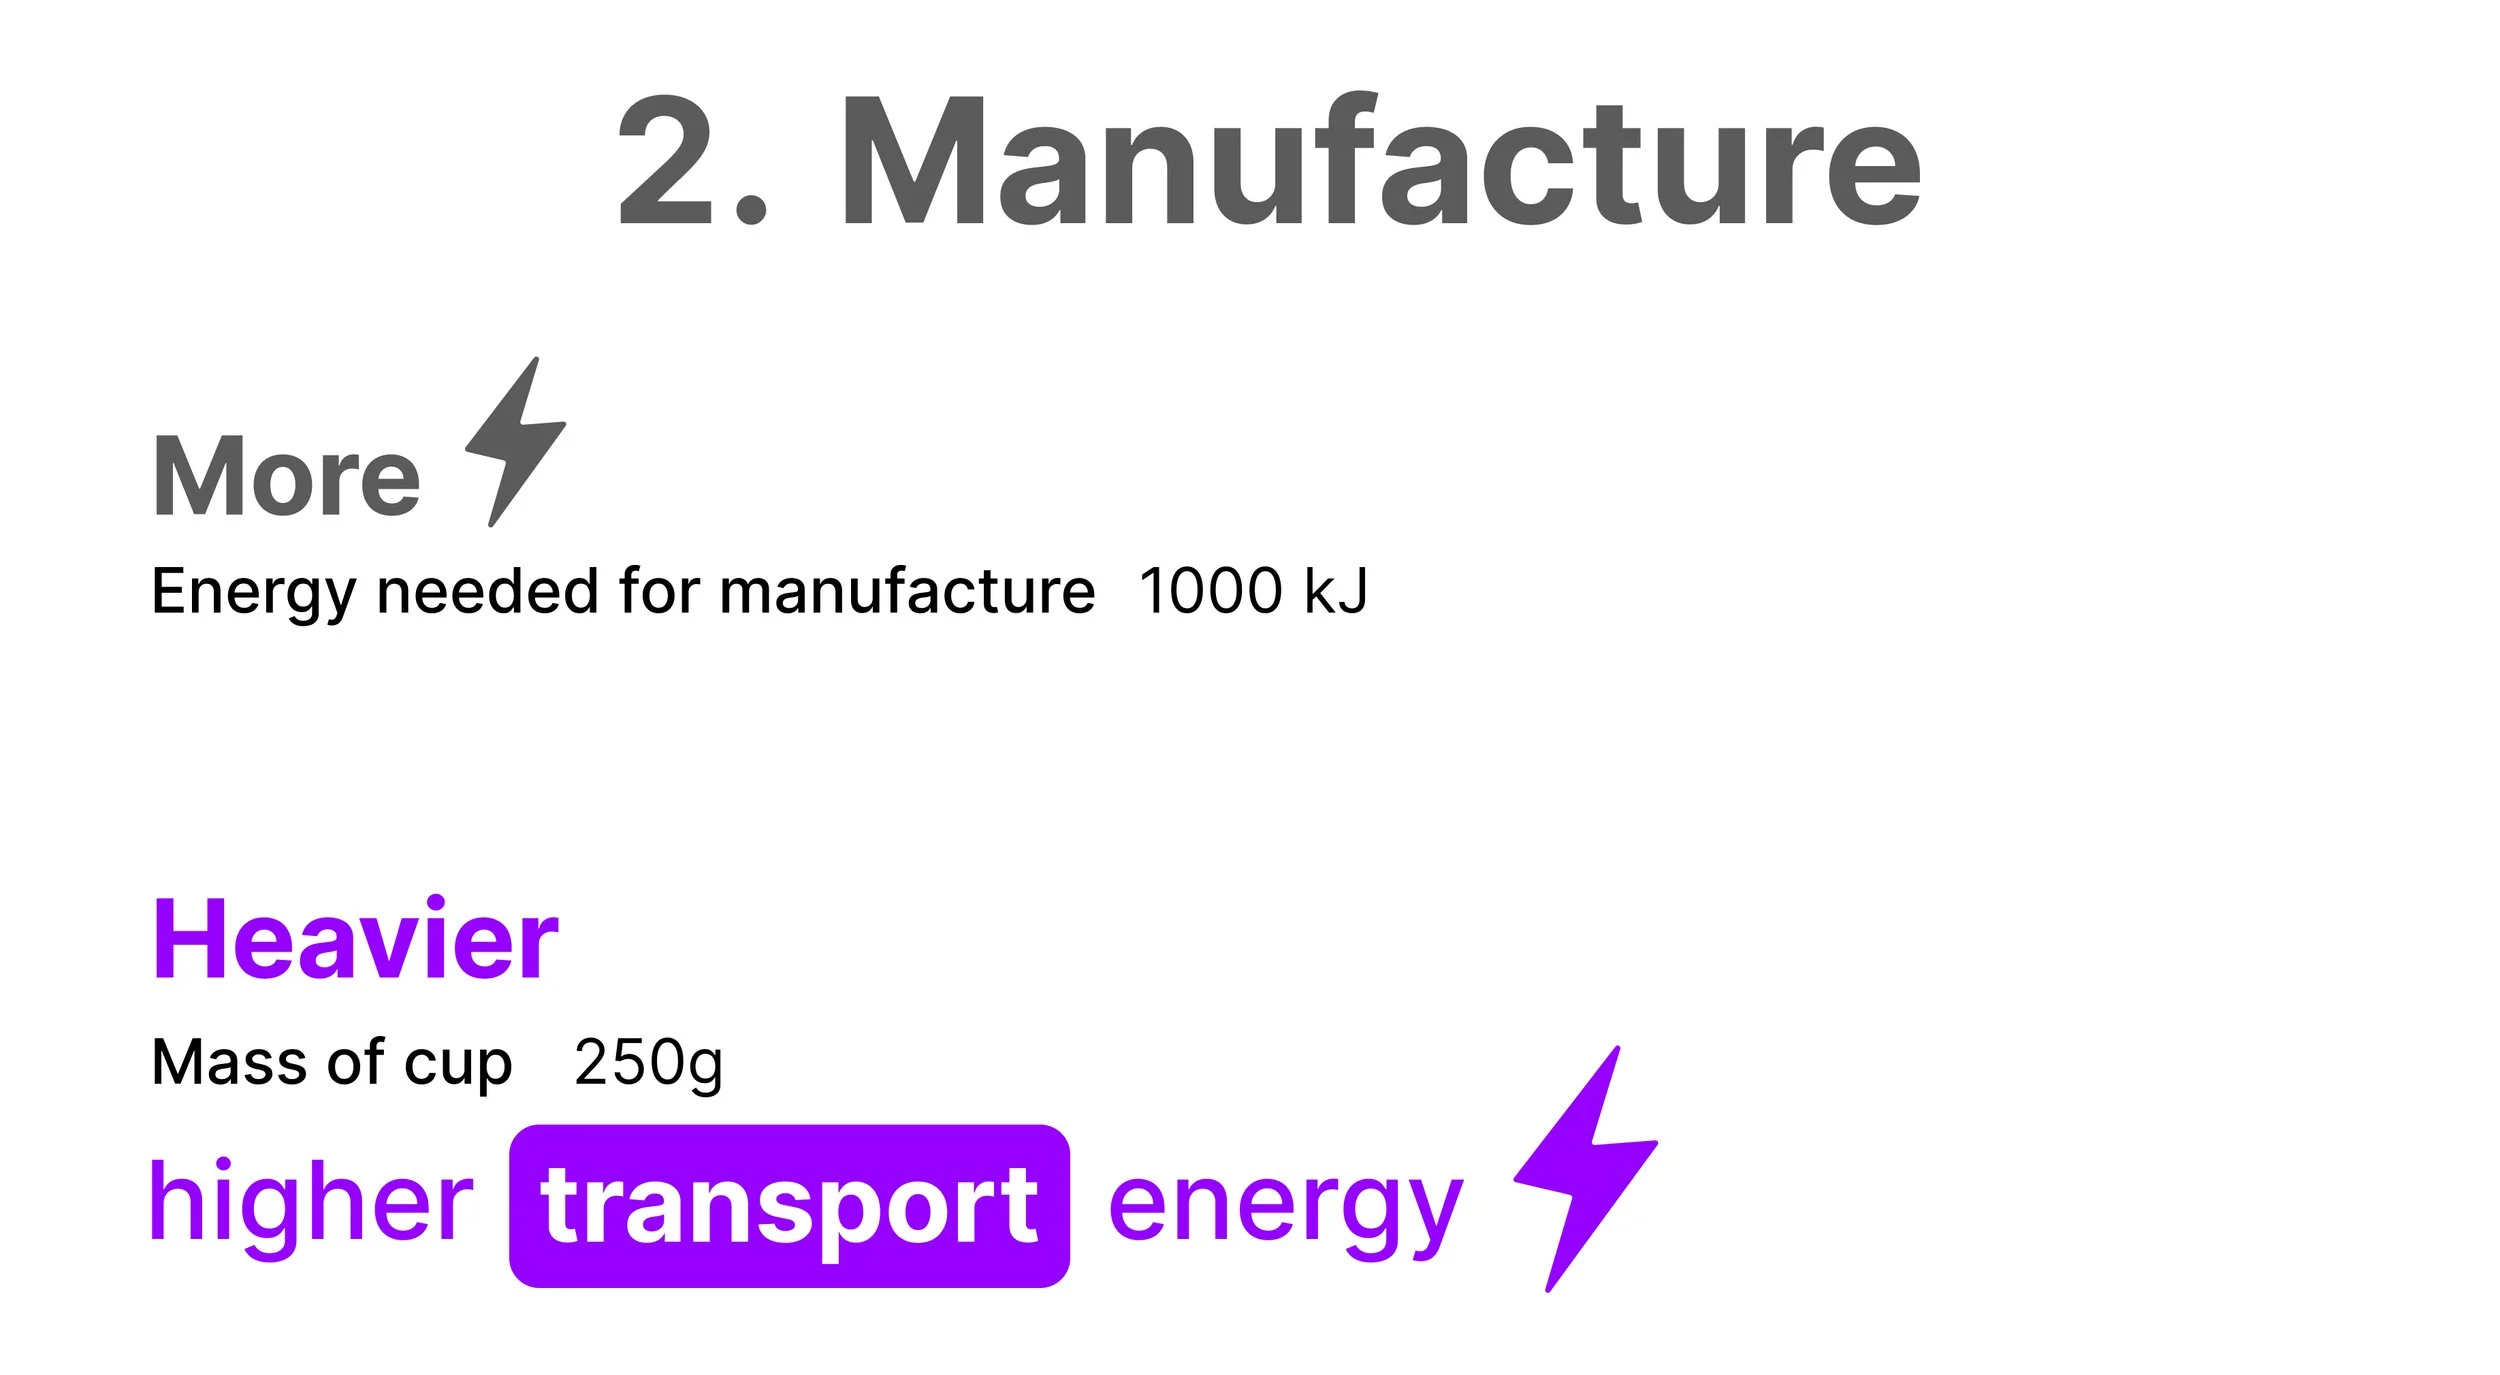
Ceramic needs more energy for manufacture (1000 kJ) as shown in the table.
A ceramic cup Is heavier (250g) so needs more energy to transport. (1 mark)
-
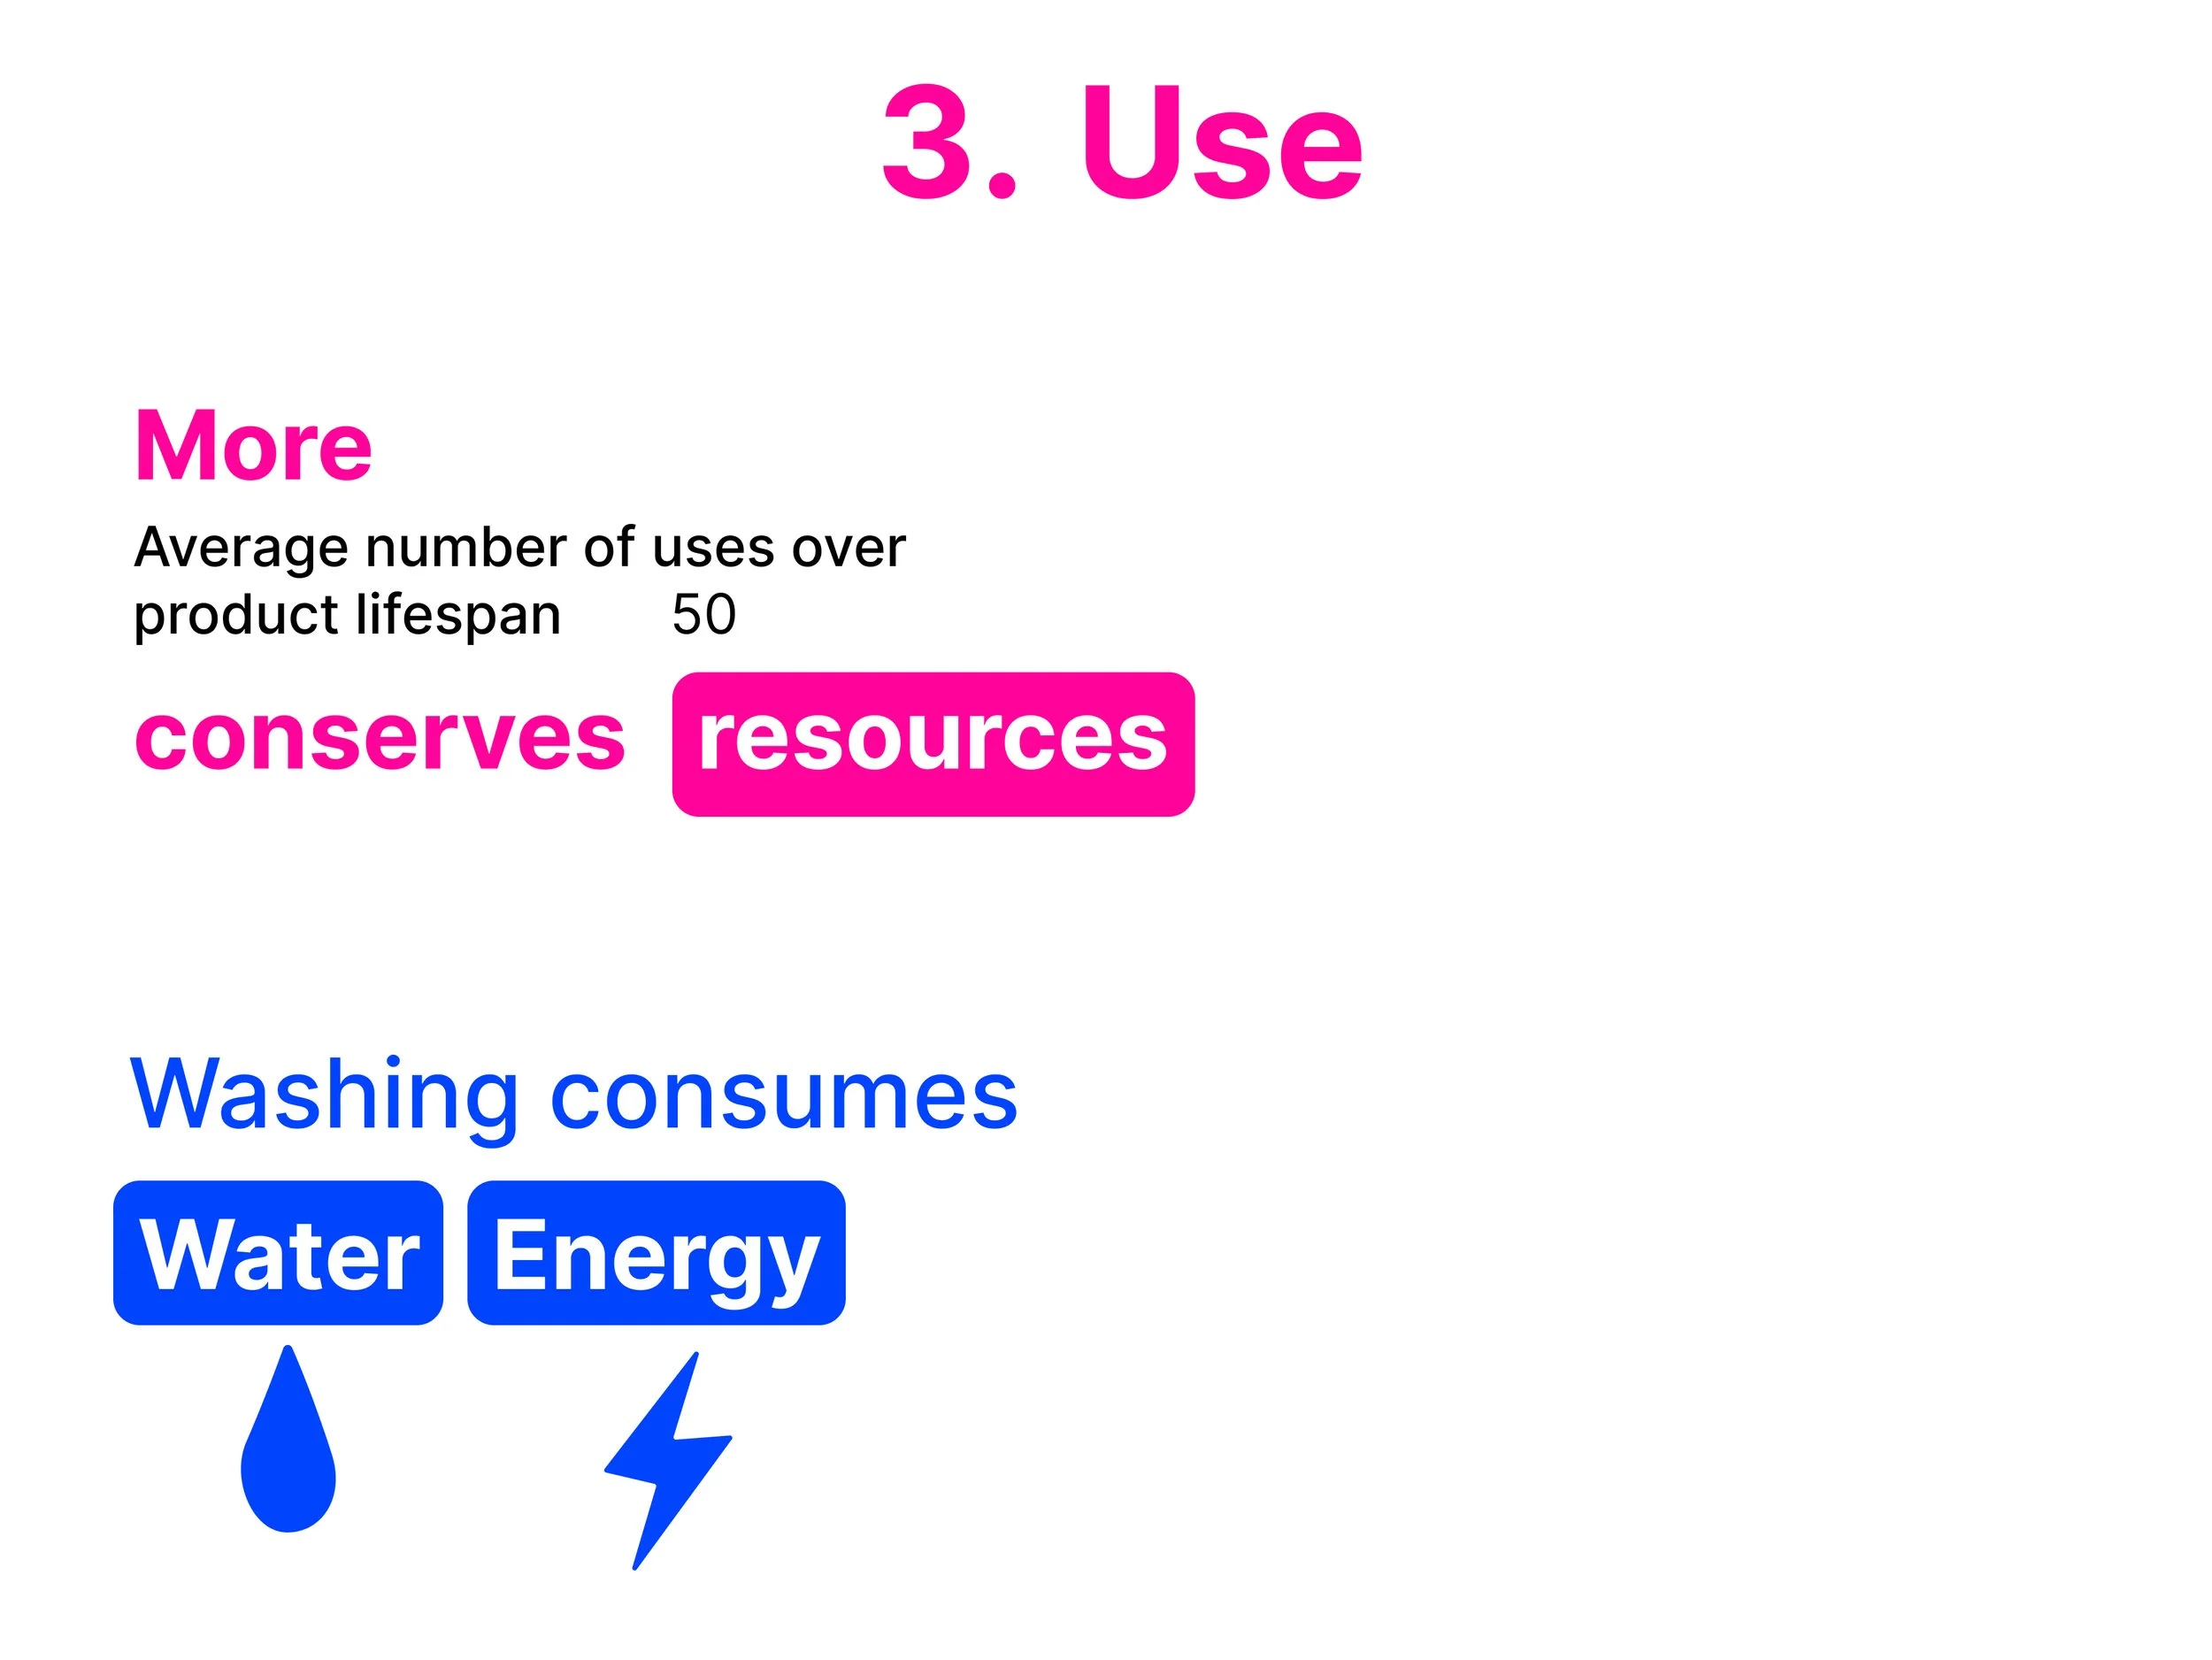
Ceramic has a higher number of uses which conserves resources.
But washing the cup consumes WATER & ENERGY.
(2 marks)
-
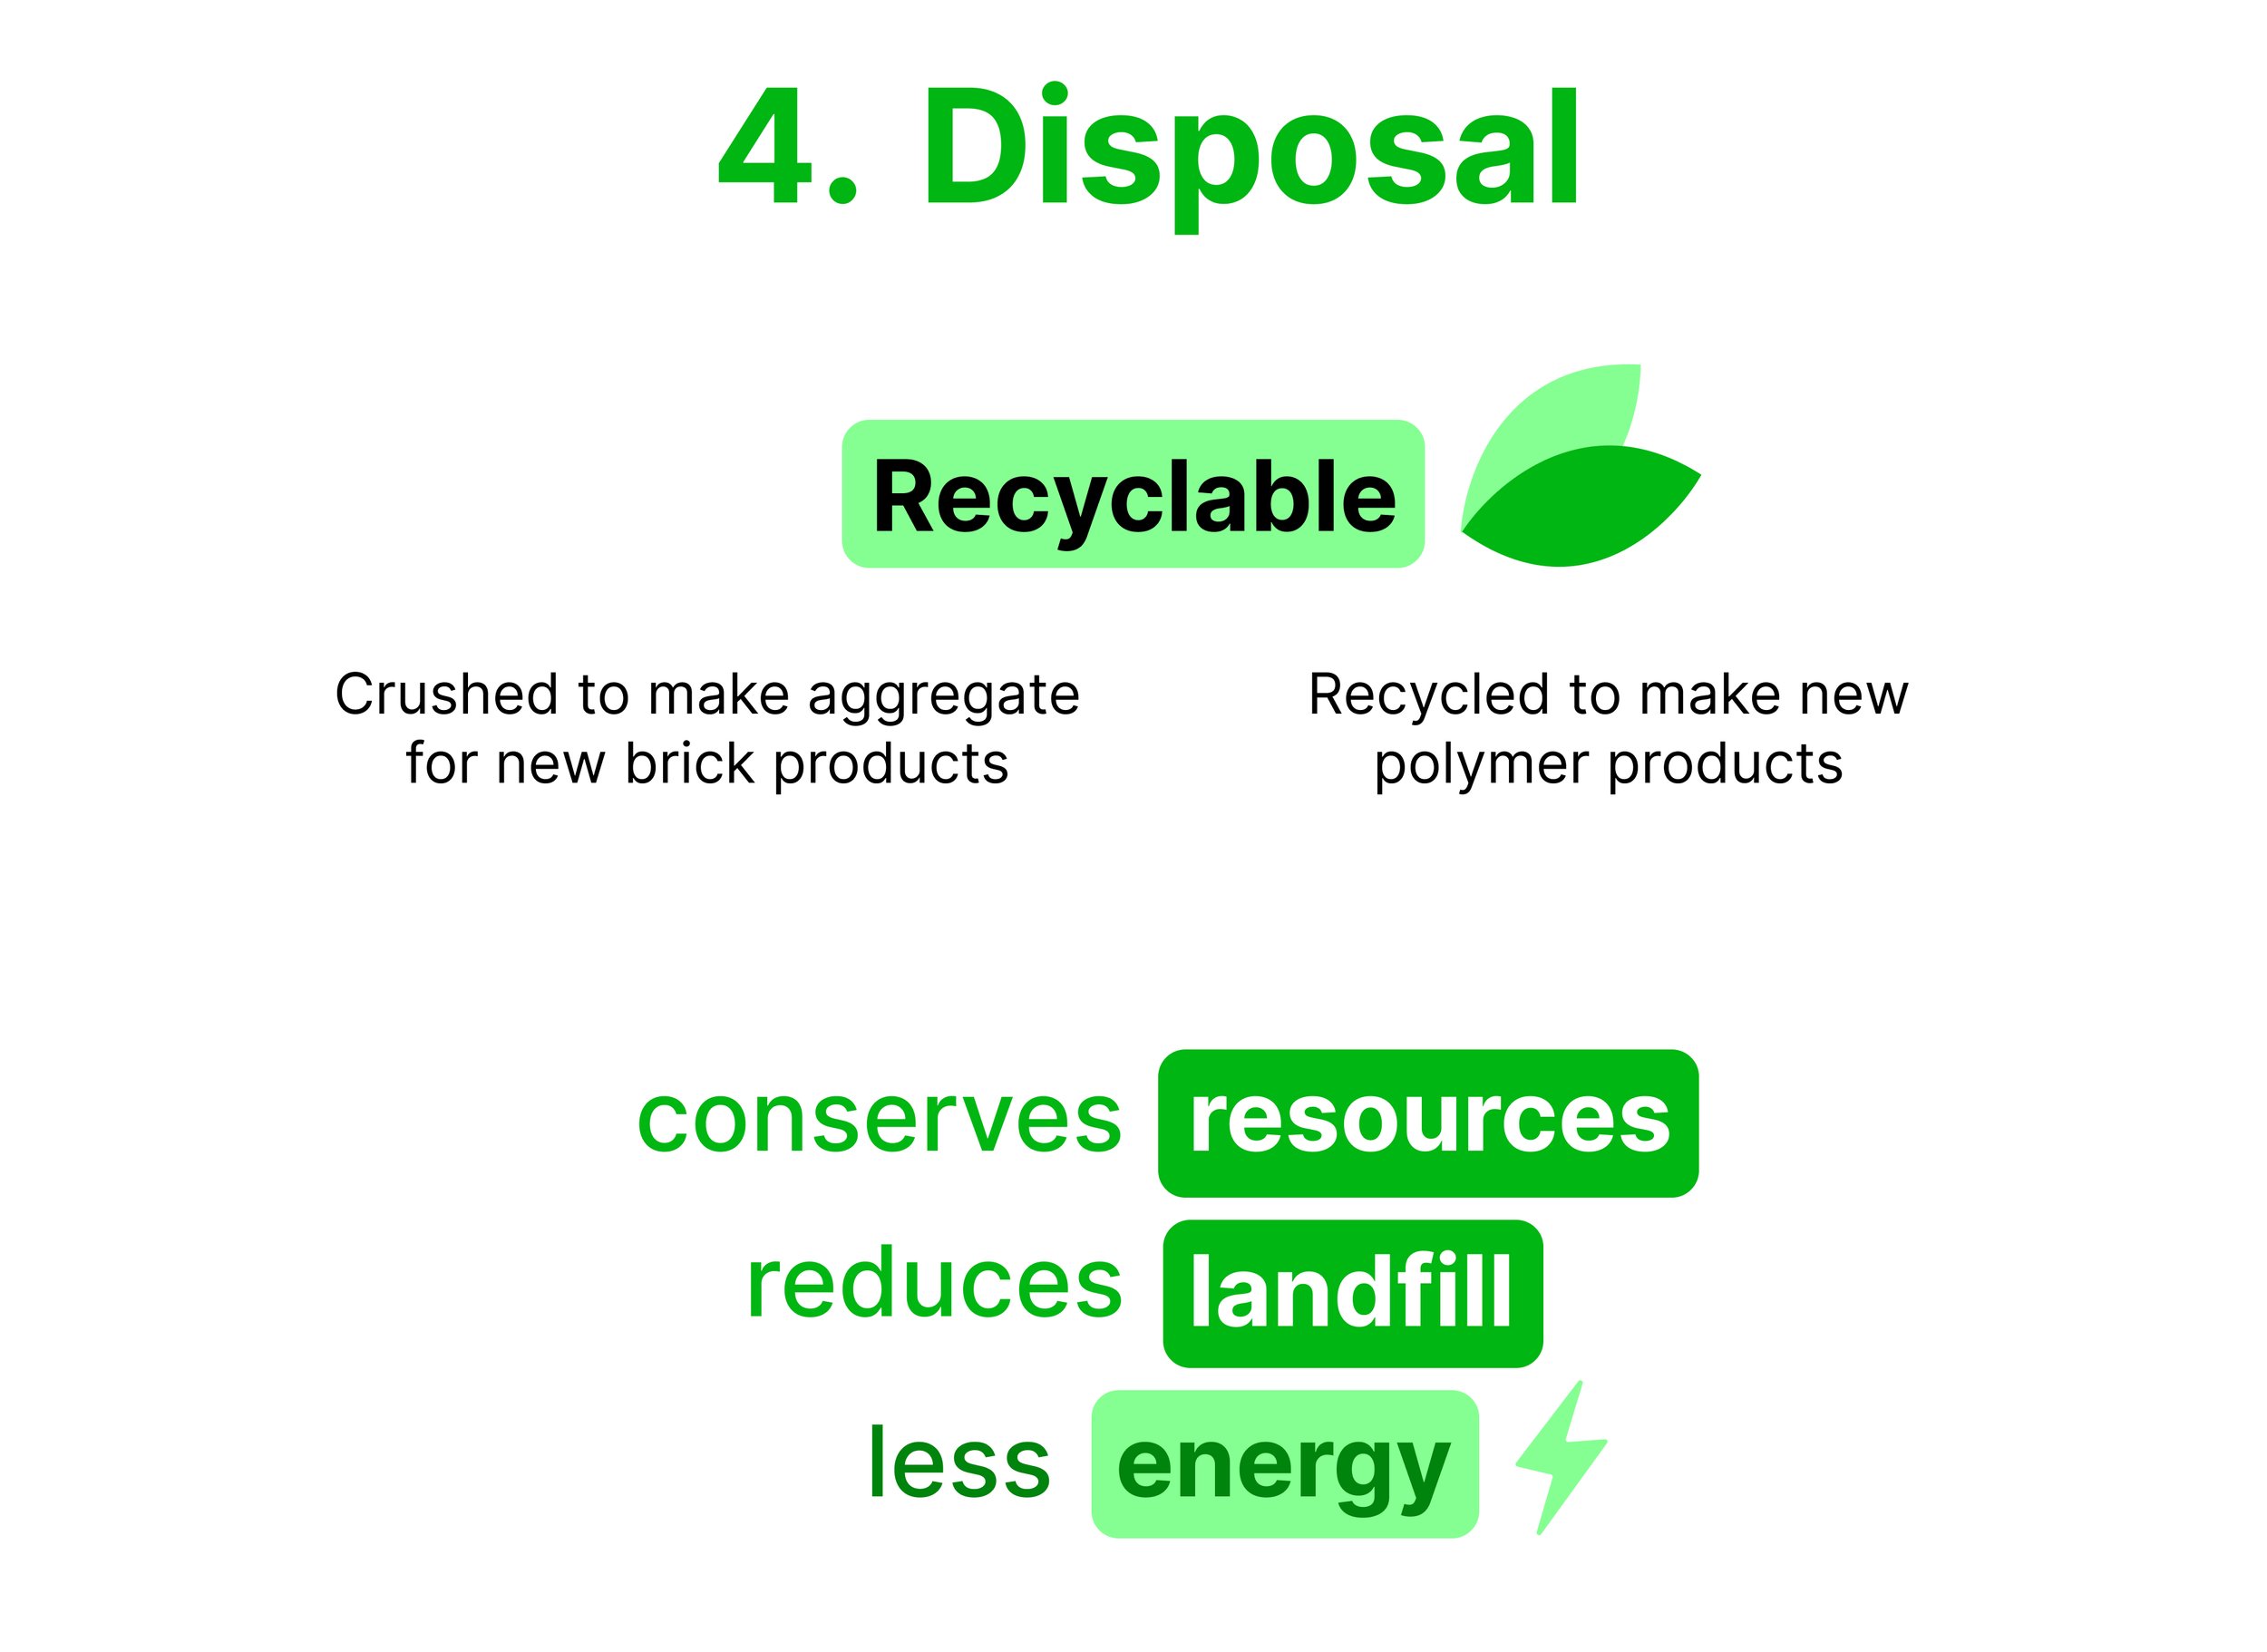
Both are recyclable based on the table.
This:
conserves resources
reduces landfill
requires less energy to make new products
(1 mark)
-
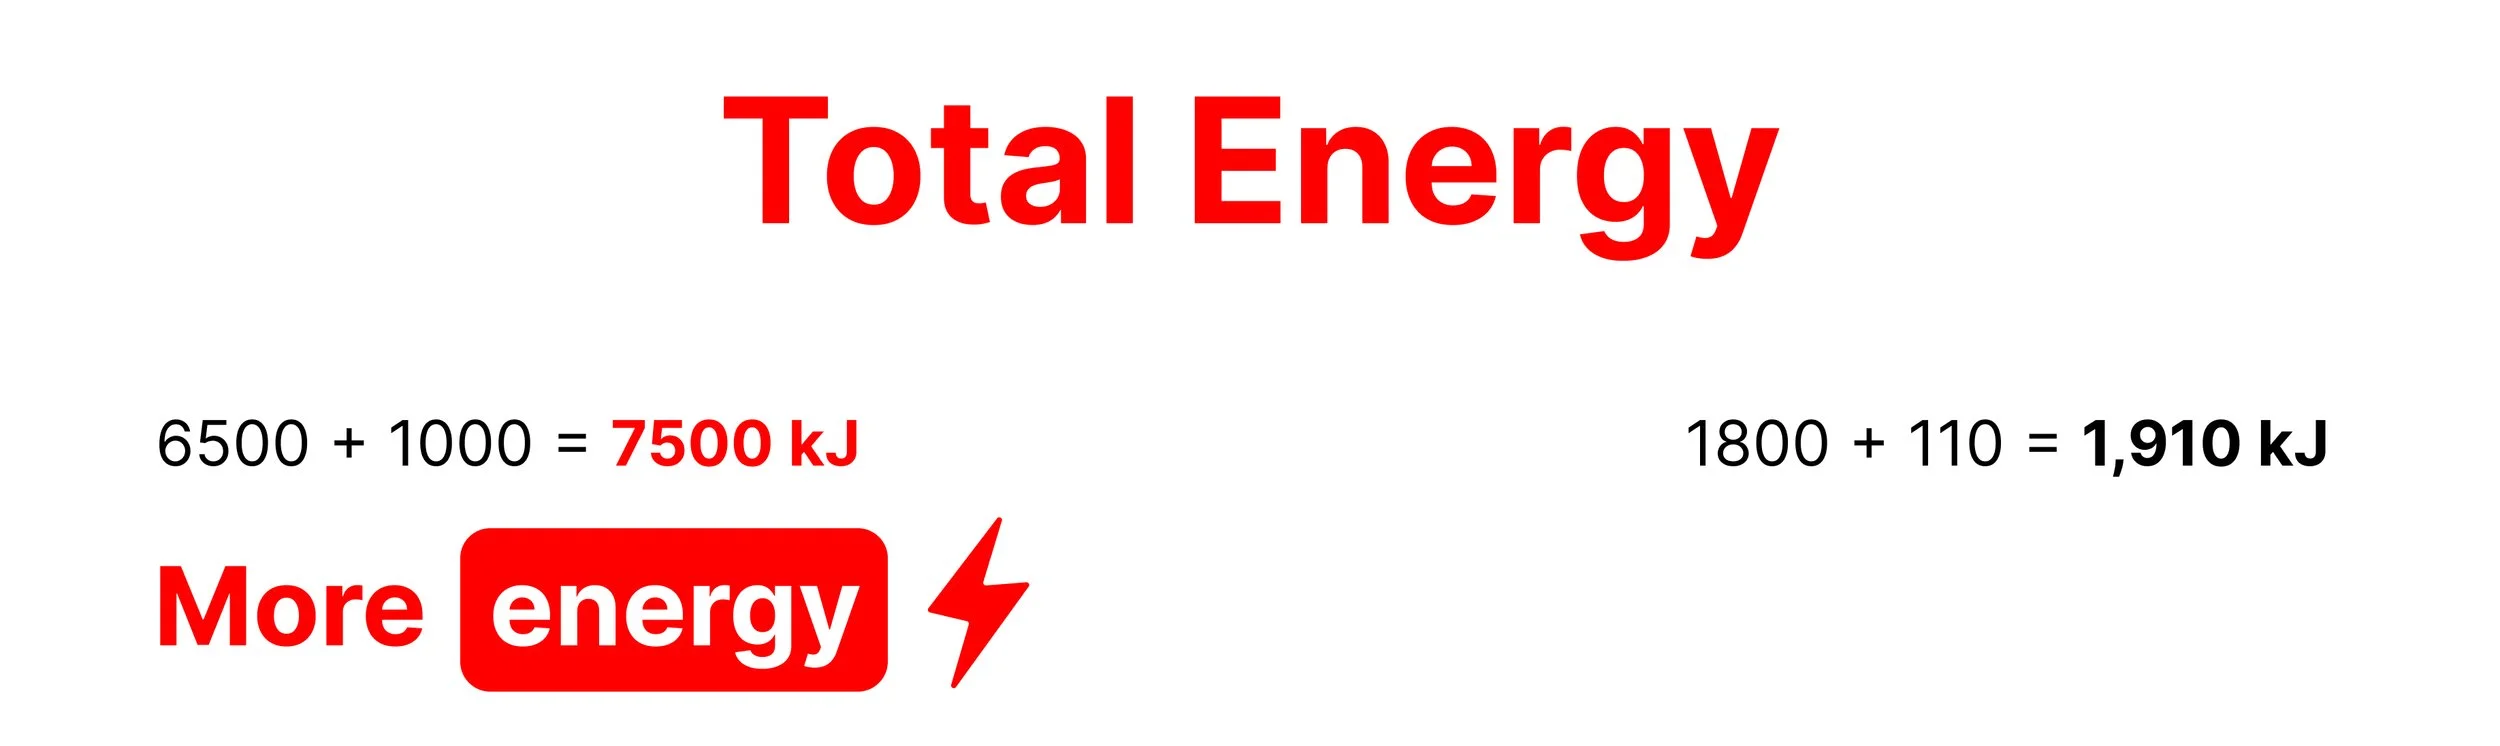
Total energy for ceramic higher at 7500 kJ (6500 + 1000).
(1 mark)