
Velocity-Time Graph - Calculating Acceleration

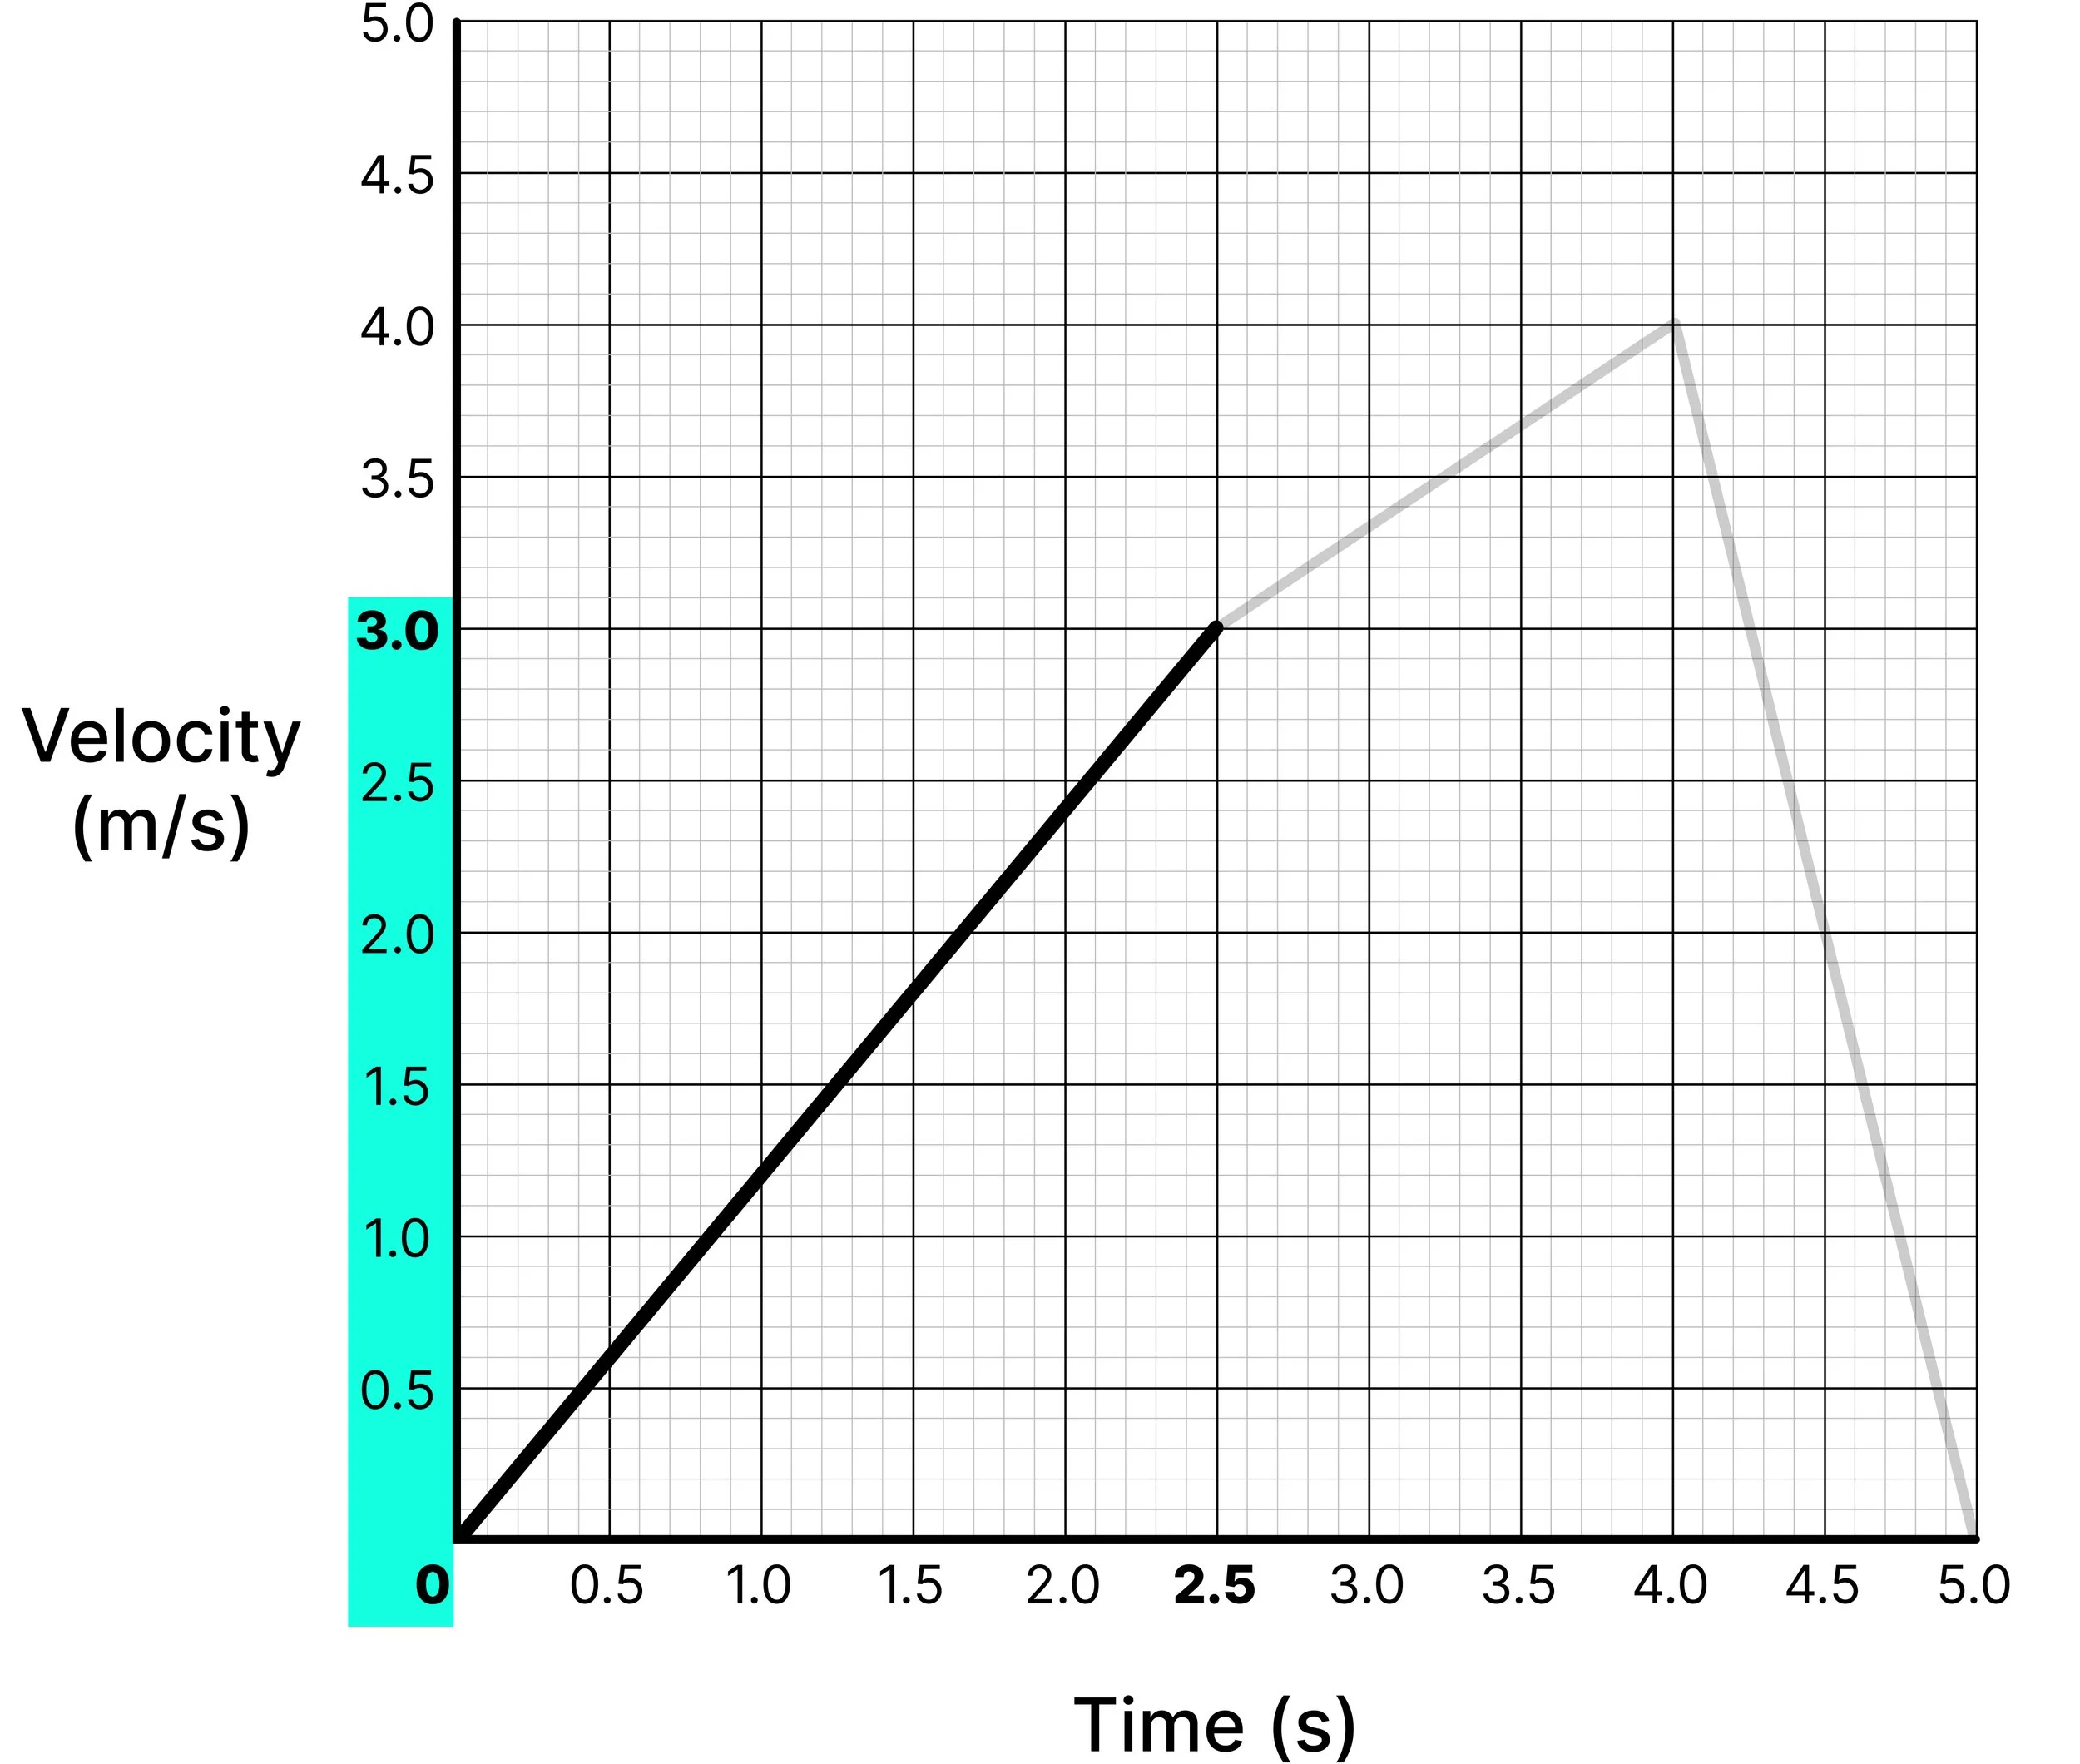
Figure 1 shows a velocity–time graph for an electric scooter accelerating along a straight road.
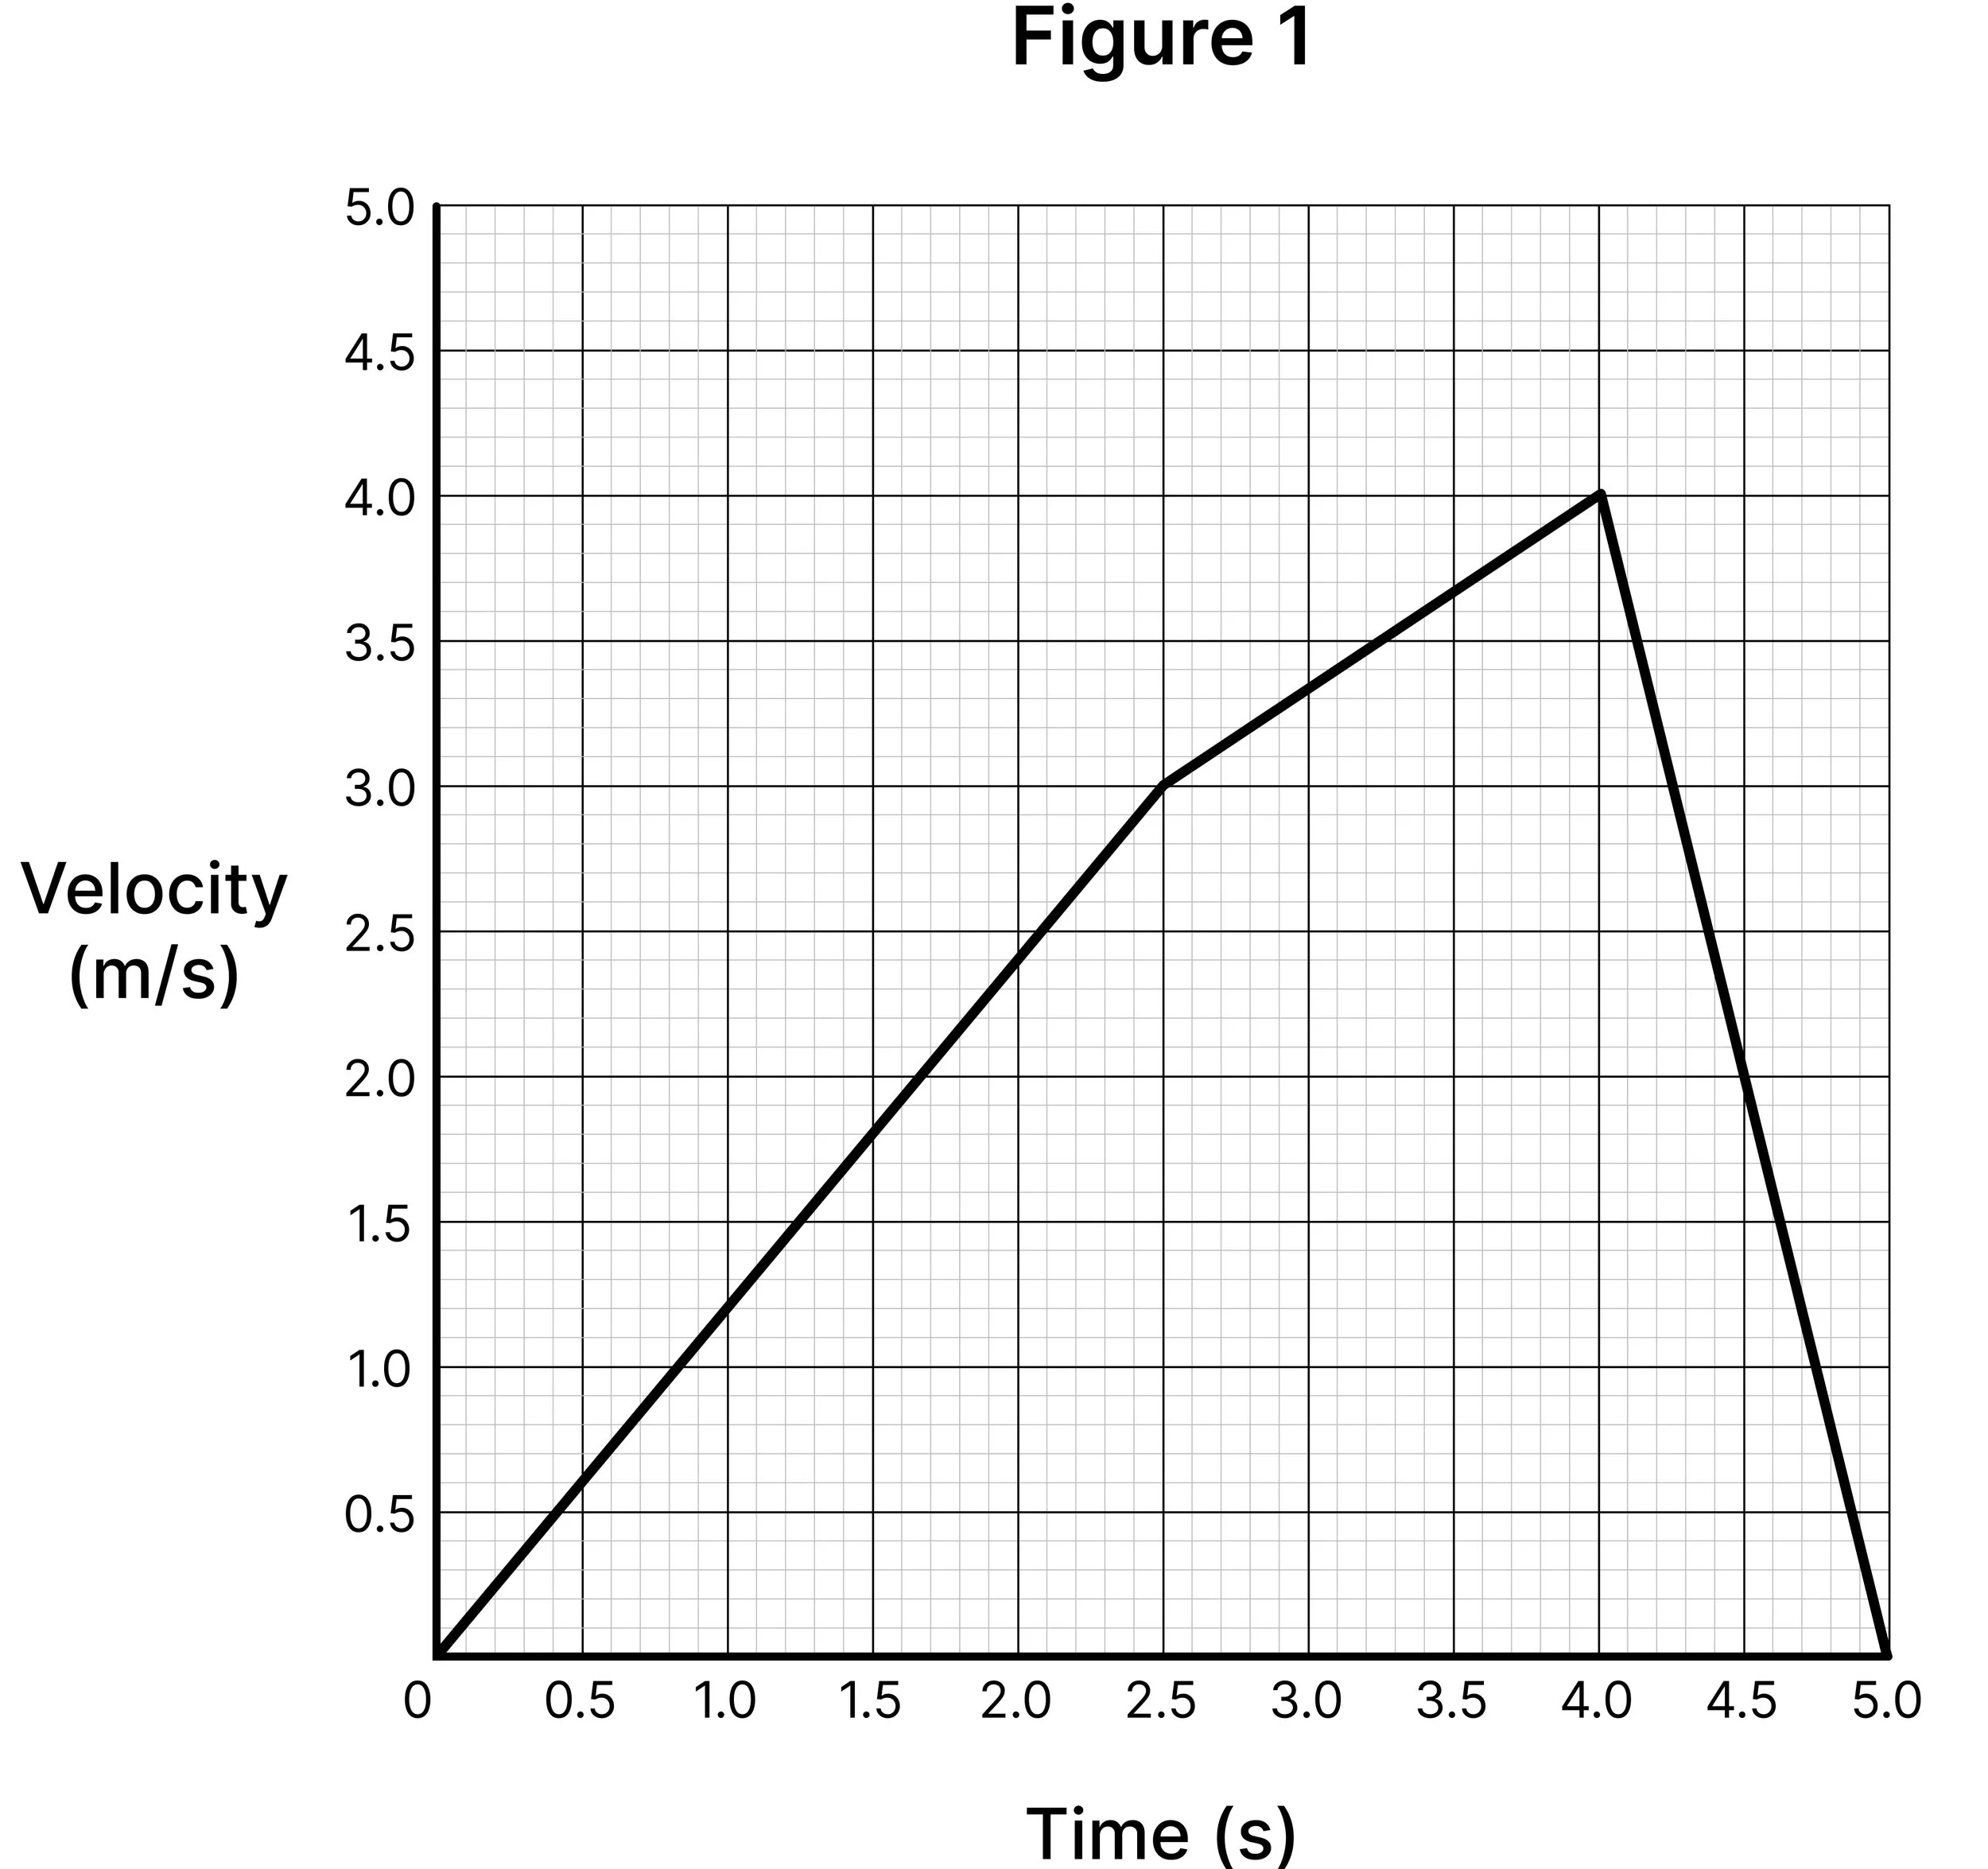
Determine the acceleration of the scooter between 0 and 2.5 s.
[2 marks]
-
From the question:
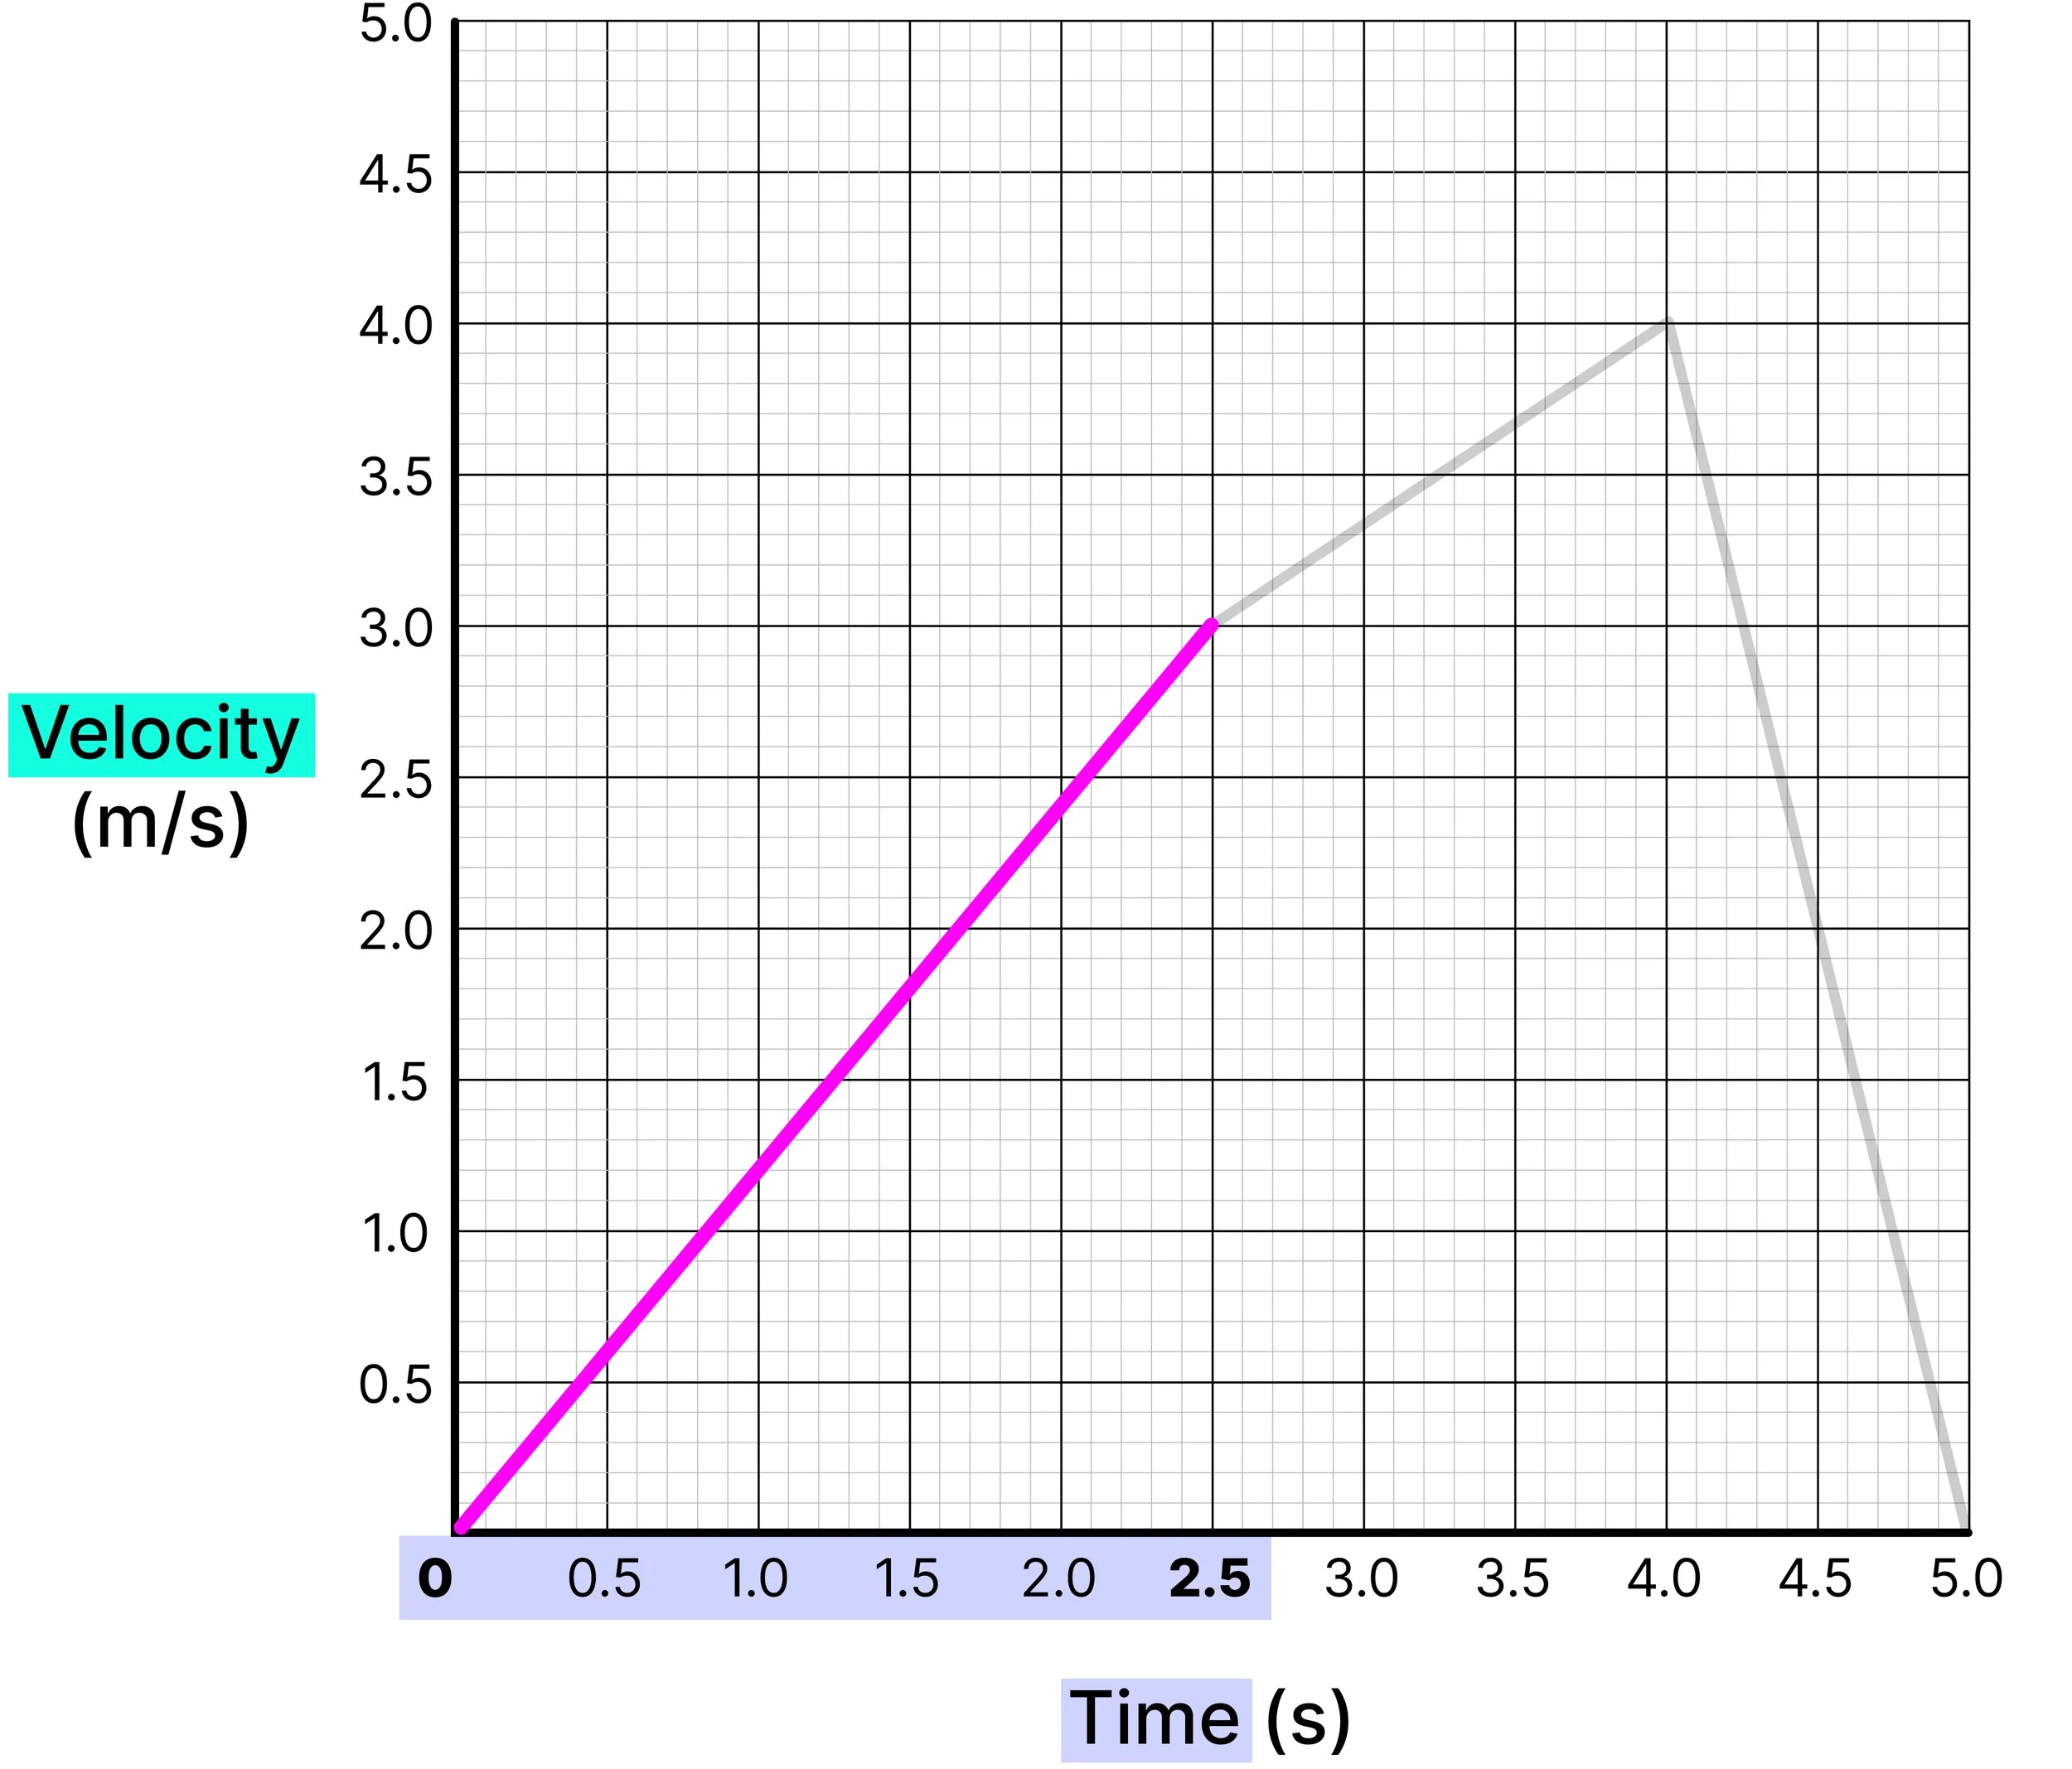
Time is between 0 and 2.5 s
We care about Velocity, Time and Acceleration (slope of graph)
-
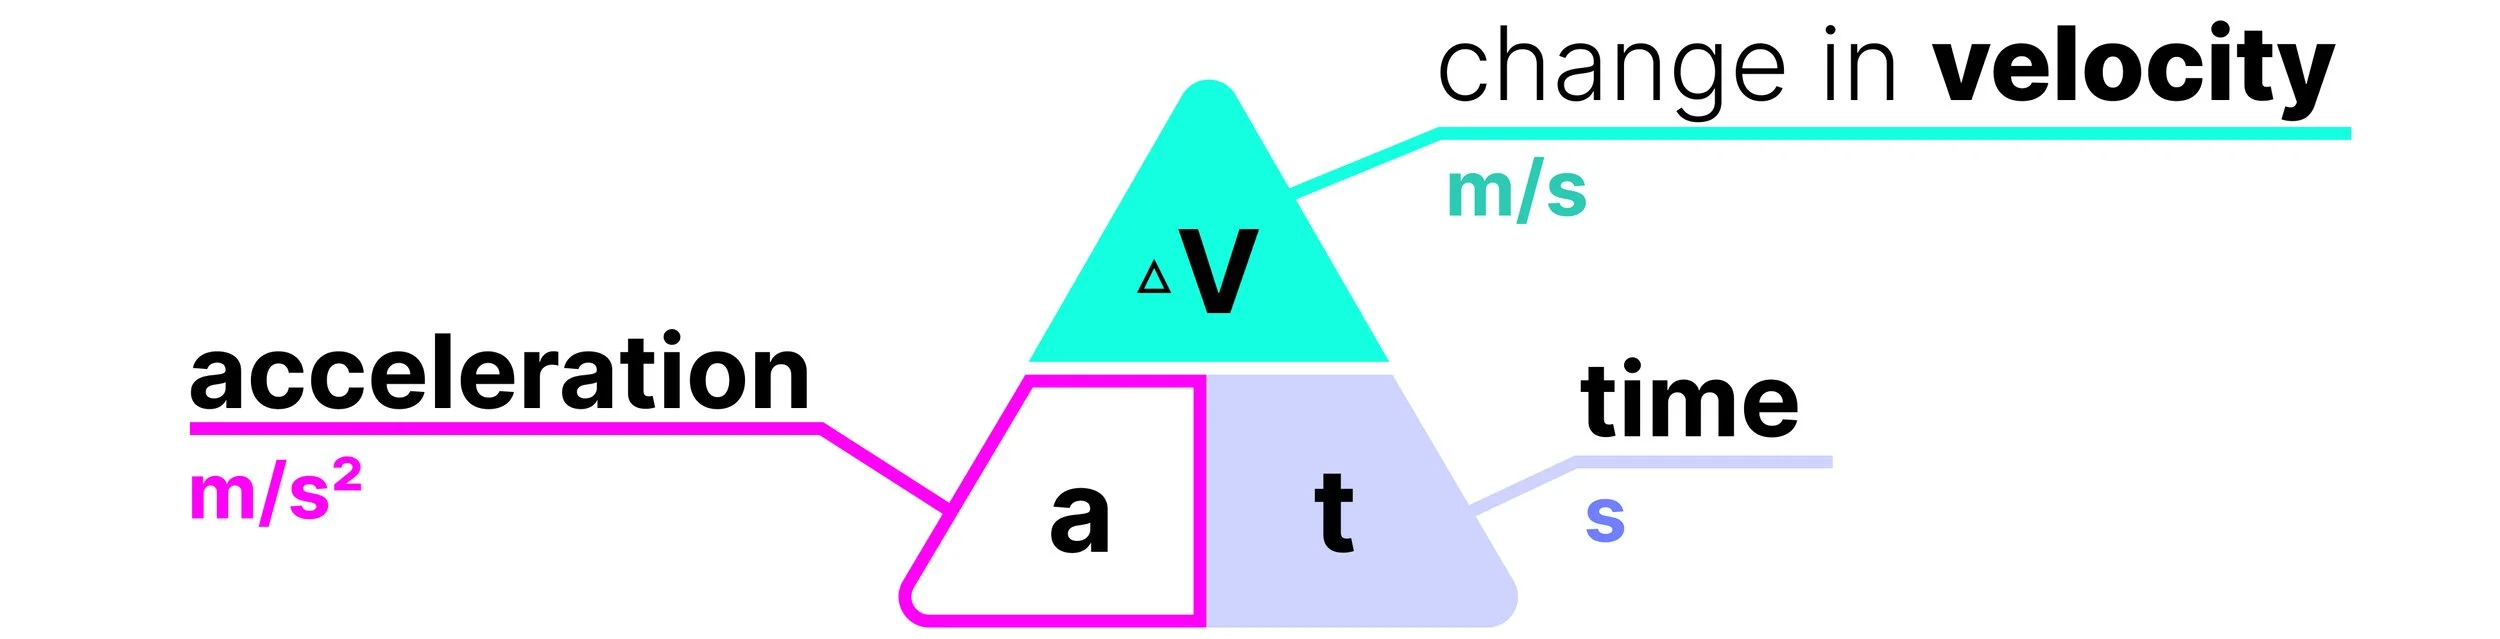
acceleration = change in velocity / time
-
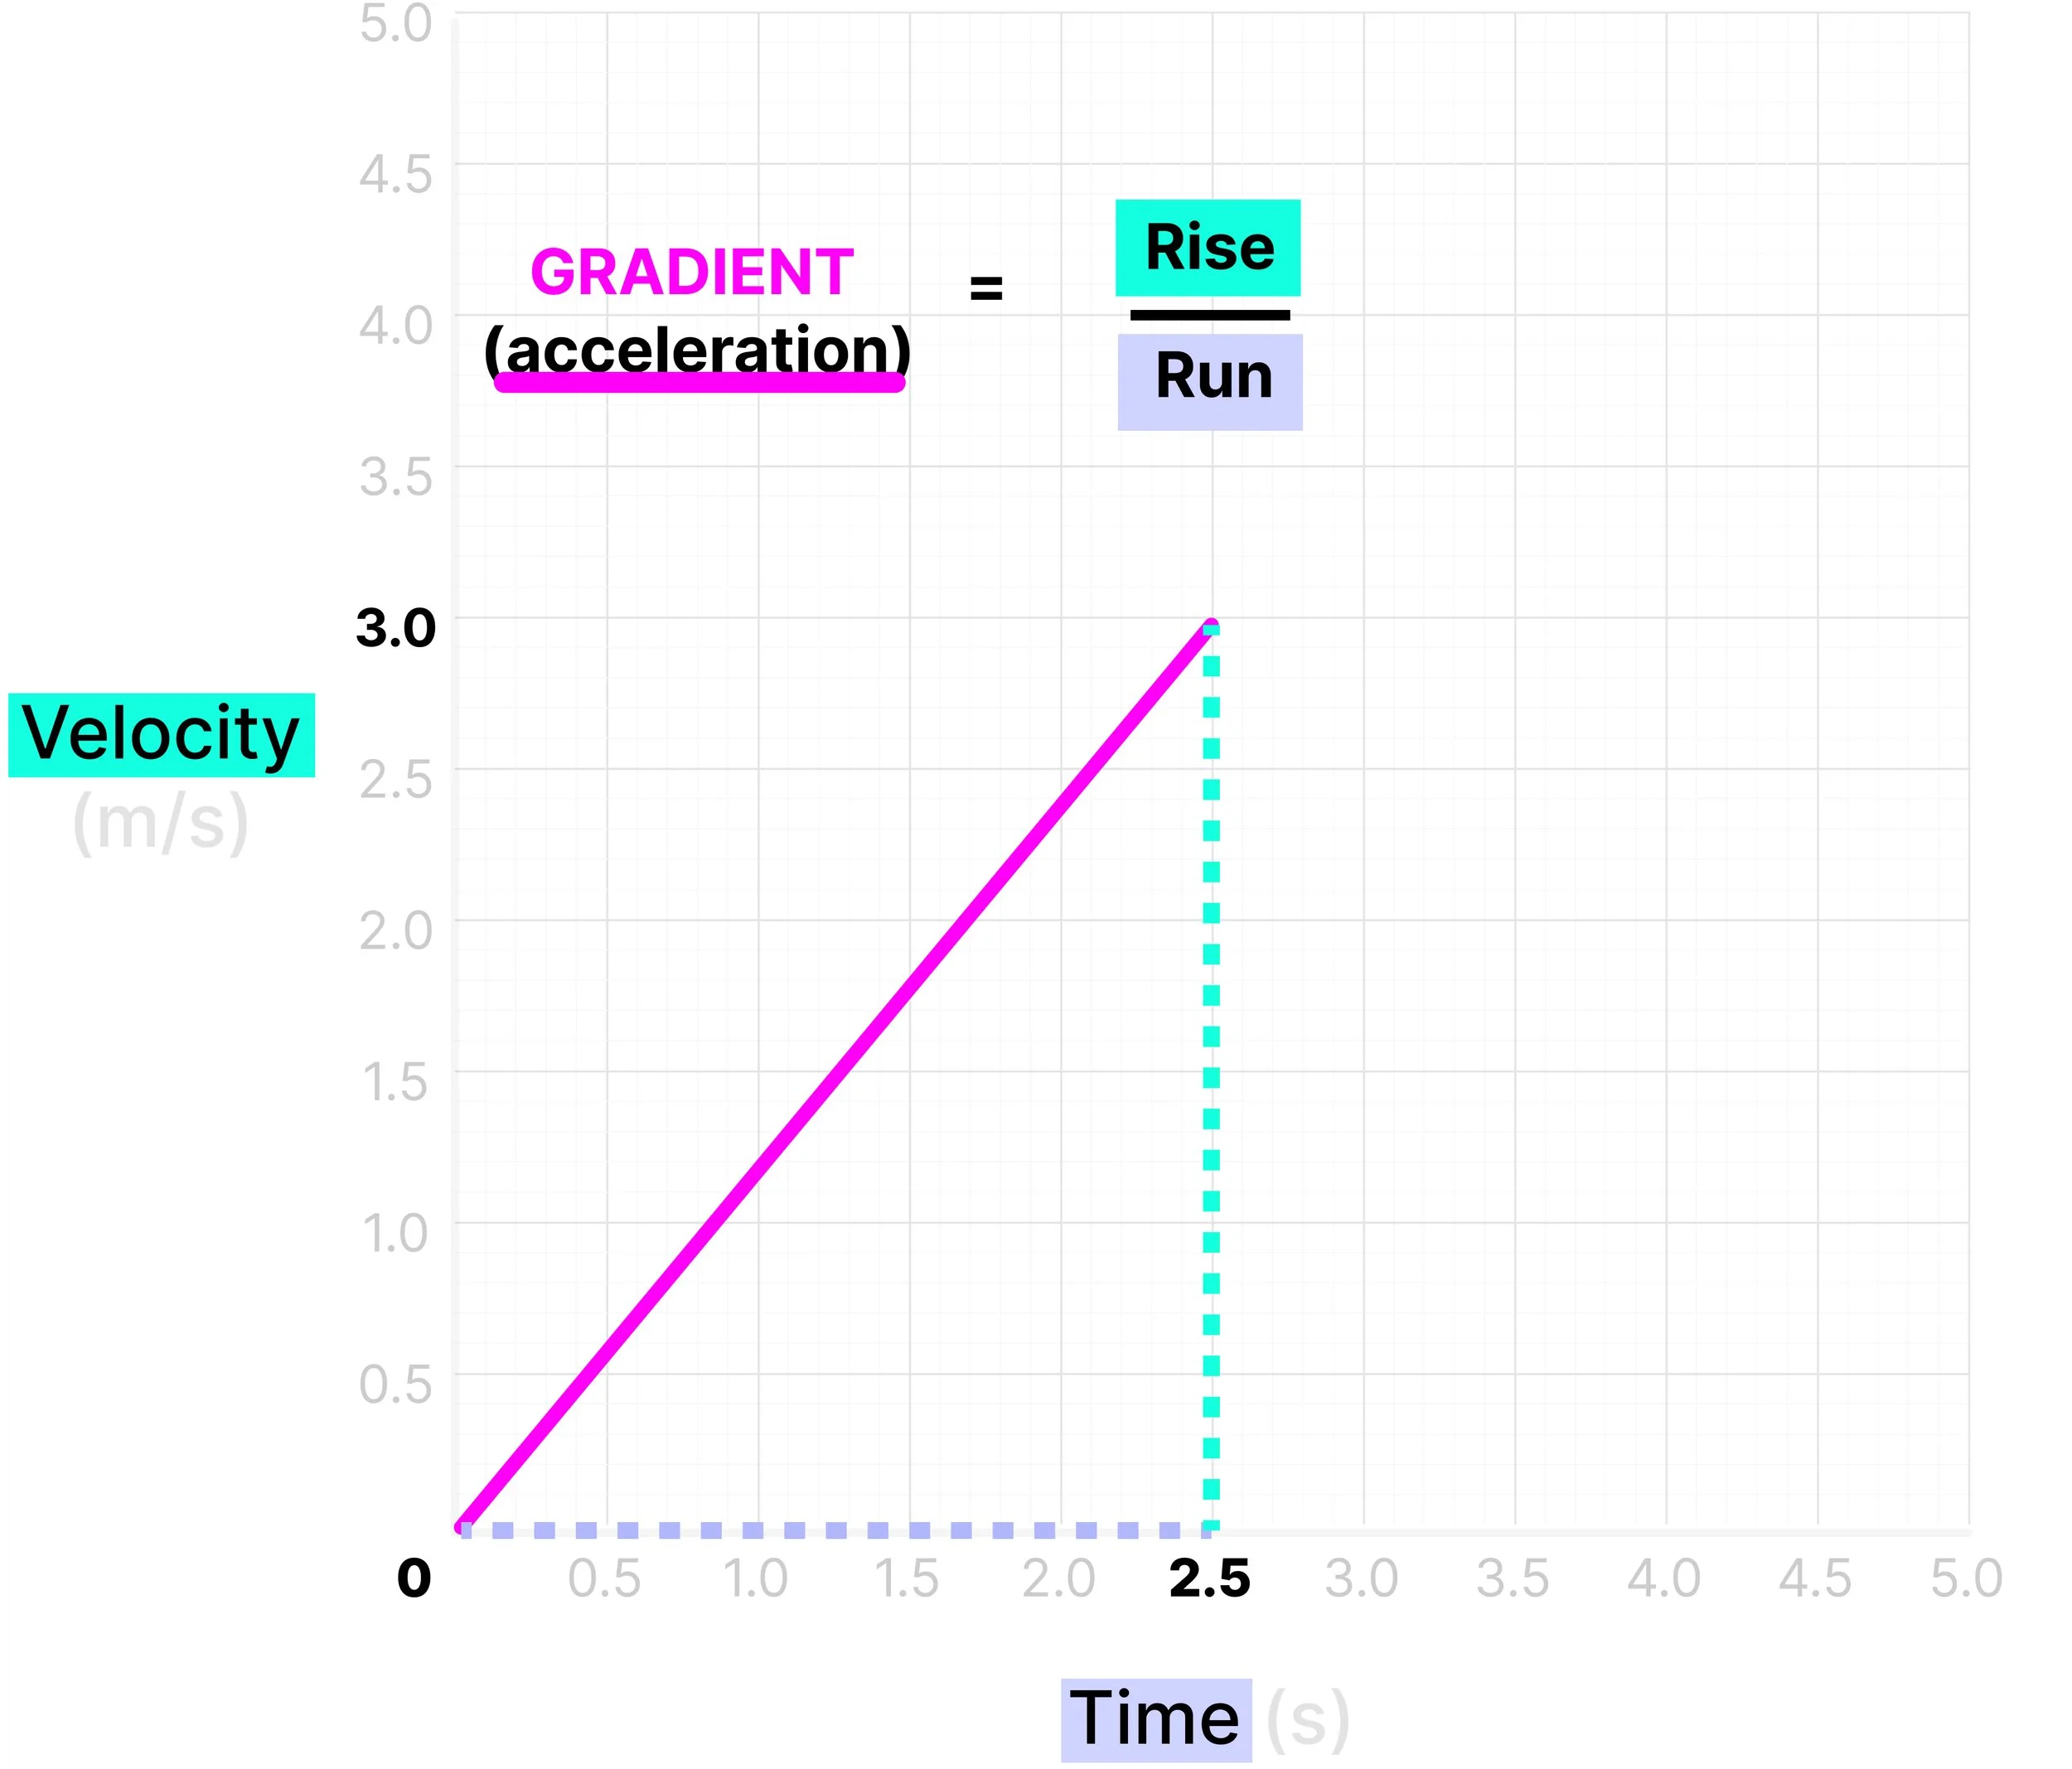
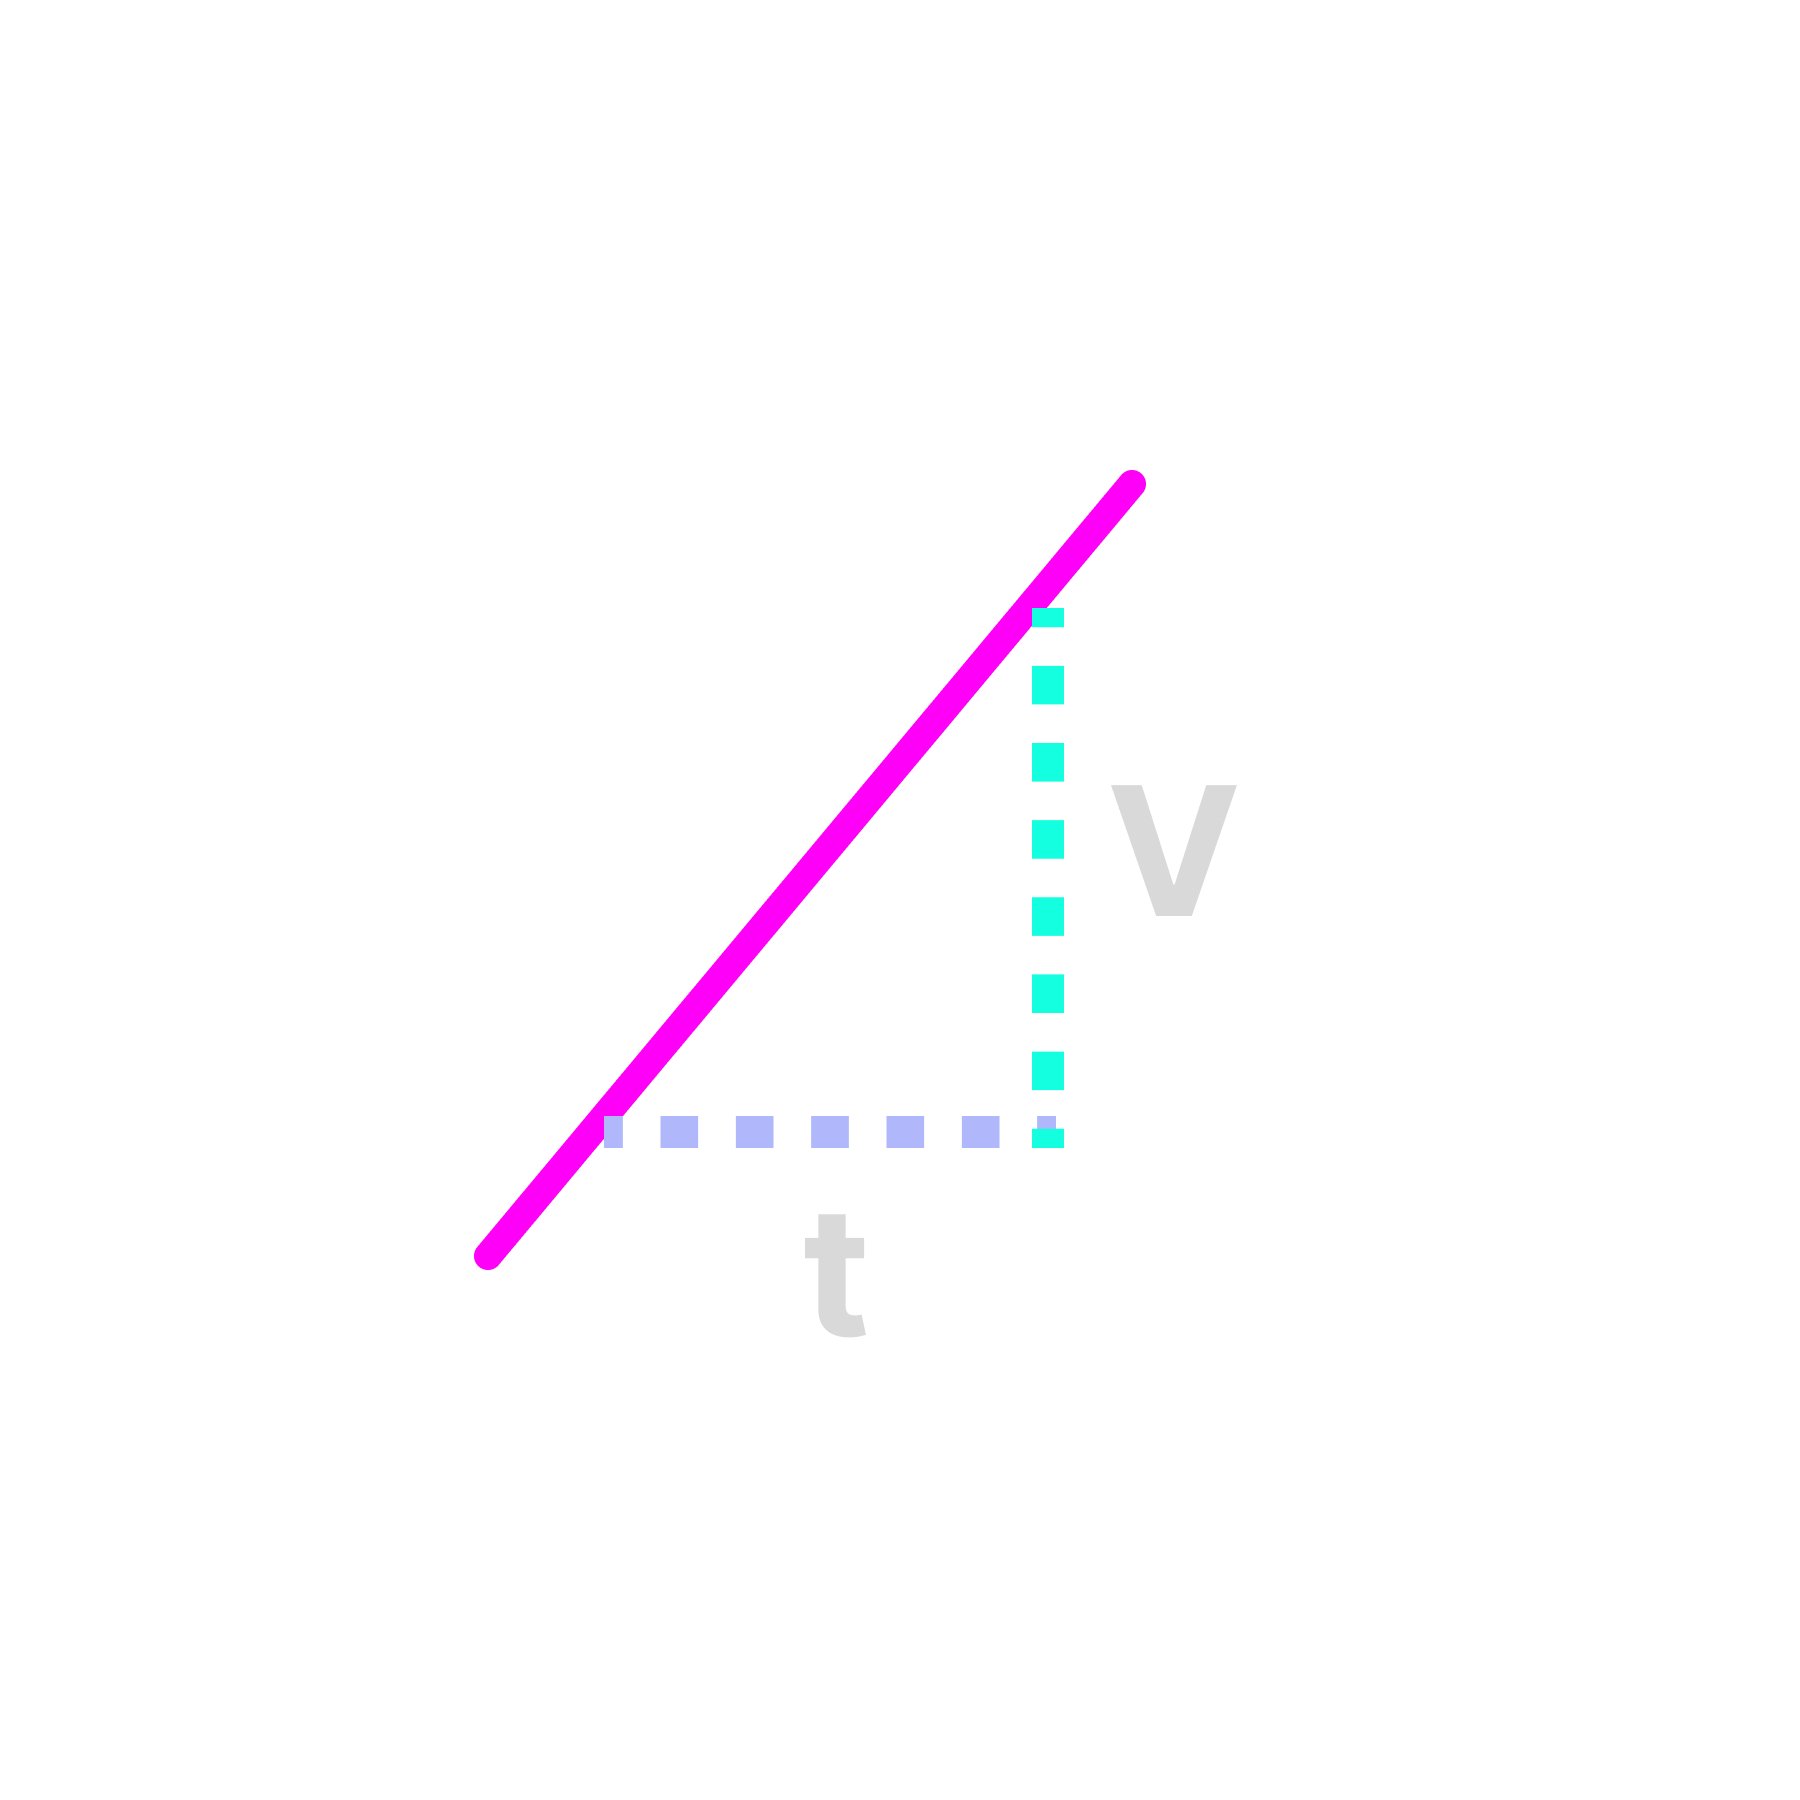
Gradient of this graph (known as Rise/ Run using a triangle in Maths):
happens to be: change in Velocity / change in Time
which is equal to Acceleration (according to the formula above)
So to find acceleration, we find the gradient
-
change in velocity = 3.0 - 0
= 3.0 m/s

-
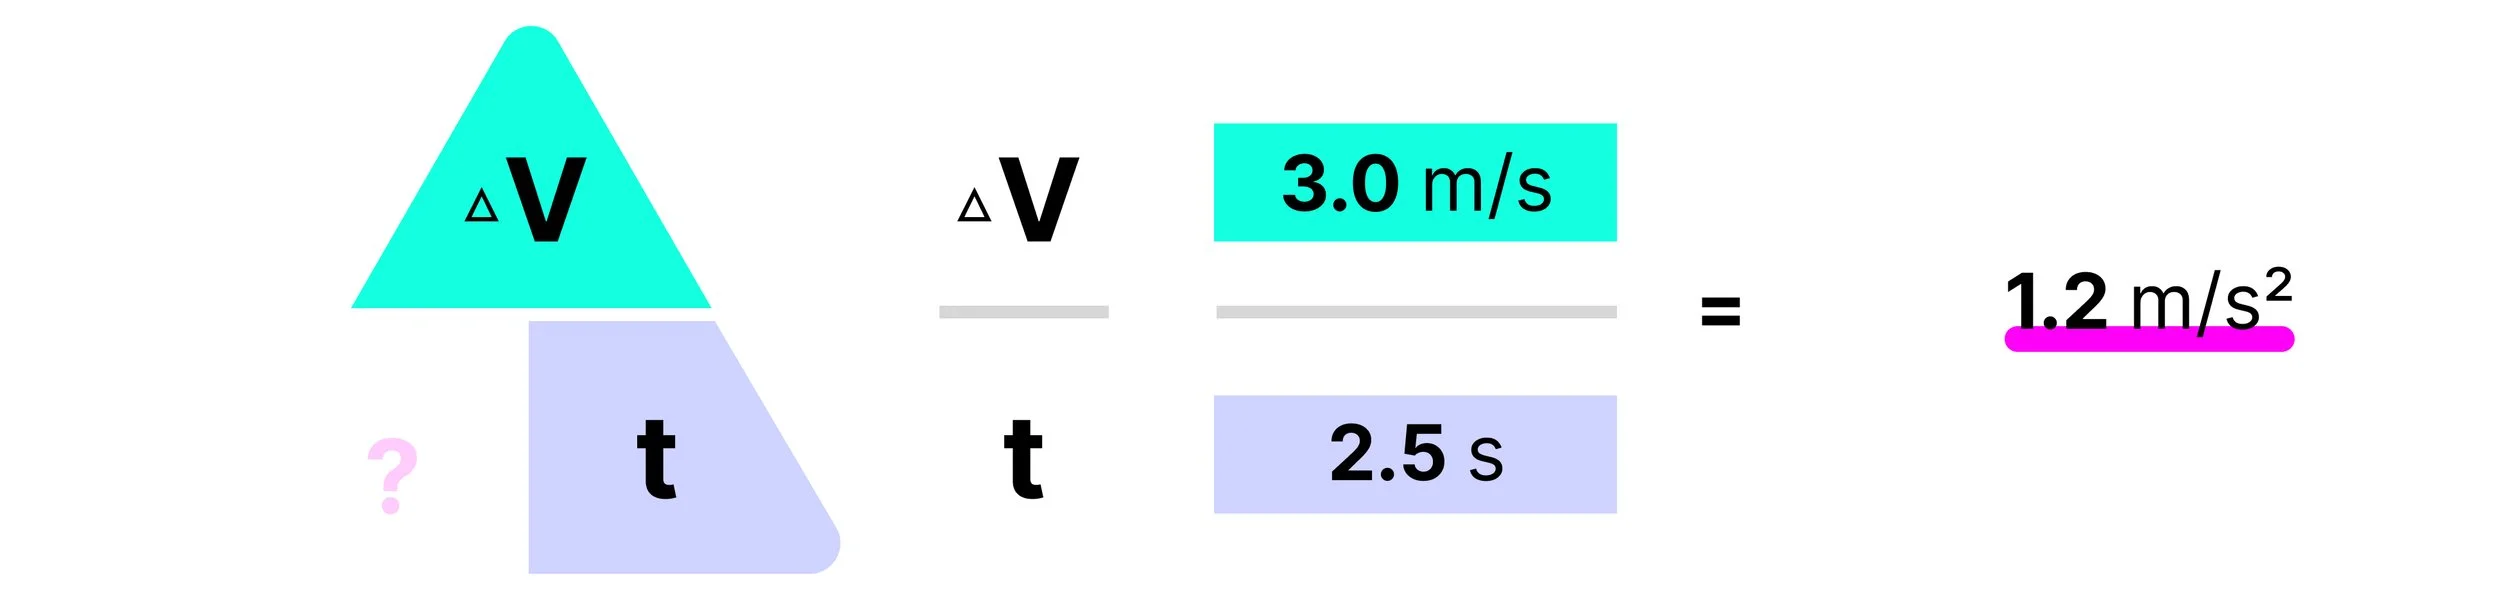
a = V / t
3.0 / 2.5 = 1.2 m/s²
Continue Revising Paper 2





Need help improving your GCSE Physics grade?
These visuals are created by our experienced GCSE tutors.
